The subject of negative interest rates is a timely and significant topic for the insurance industry today. This white paper will review the use of negative interest rate policy in various regimes and the implications it has for the insurance universe.
Definition
Negative interest rate policy (NIRP) is a monetary policy implemented by a central bank that sets nominal target rates at a negative value, below the theoretical lower boundary of zero percent. NIRP is an unconventional monetary policy which had been purely theoretical until recent years. The policy is meant to expand the money supply and spur investment in response to a disinflationary or outright deflationary environment.
Practically, a central bank will implement NIRP by lowering the overnight target rate on the banking system’s fractional reserves to a negative rate. In effect, reserves deposited at the central bank by the member banks will be charged for the privilege rather than being paid or being charged nothing. In banking systems (or countries) where NIRP has been implemented, negative rates are typically applied to excess reserves above the central bank required minimum.
The negative target rate also serves as an anchor for the yield curve, bringing down the sovereign yield curve more broadly. By penalizing savings, the central bank motivates banks and their depositors to find alternate uses for deposits, including more lending and investing in risk assets that generate returns in excess of zero percent.
Real World Examples
NIRP has been implemented in several regimes in recent years in response to persistent low growth environments. Denmark, Sweden and Switzerland all implemented the policy in 2014 followed by the European Central Bank. Then, in early 2016, the Bank of Japan introduced NIRP as its previous stimulus plan faltered.
| Key policy rates for implementation of negative interest rates |
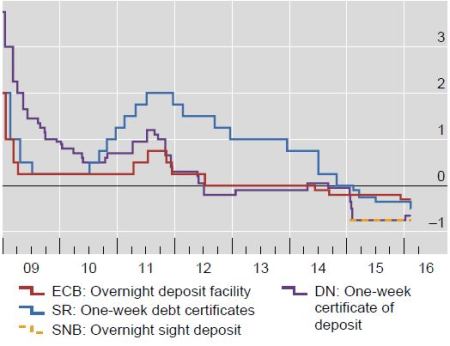 BIS Neg Paper, p. 34 BIS Neg Paper, p. 34 |
The implementation of NIRP has accelerated the trend in falling sovereign yields throughout the jurisdictions where it has been implemented.
| Pass-through beyond money markets – Euro area |
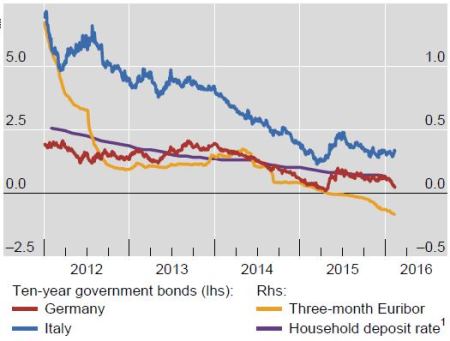
BIS Neg Paper, p. 34
|
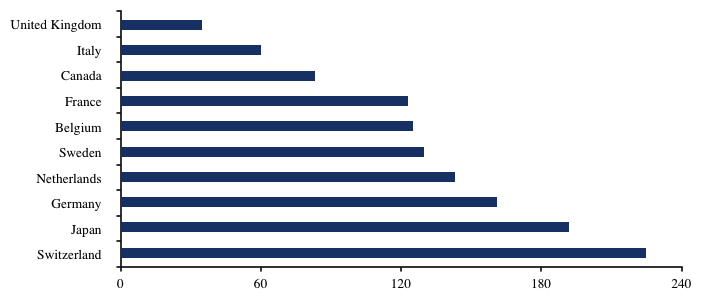
Currently negative yielding sovereign securities total $11.5 trillion, representing approximately 30% of the outstanding supply.
| Negative yielding securities in the GBI Broad and EMU indicies are at historical highs |
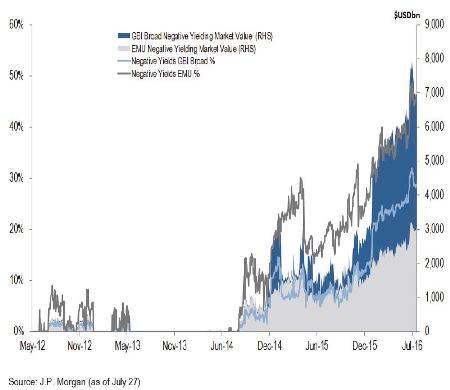 JPM Neg Yields, p. 2 JPM Neg Yields, p. 2 |
Impact on Insurance Companies
As it relates to insurance companies, negative rates impact both sides of the balance sheet.
From an asset perspective, NIRP aggravates the impact of an already protracted low interest rate regime.
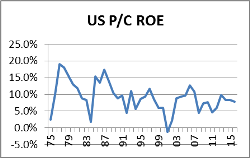
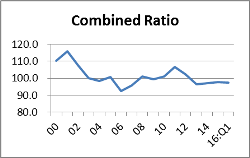
For P&C companies, NIRP continues the downward ROE trend of the last twenty years. The days of being able to generate acceptable returns while maintaining a combined ratio in the 100 range are gone. The Insurance Information Institute estimates that just to maintain current depressed ROE, the industry needs to reduce its combined ratio to the low 90s.
| US P/C ROE | Combined ratio |
|
Insurance Information Institute |
Insurance Information Institute |
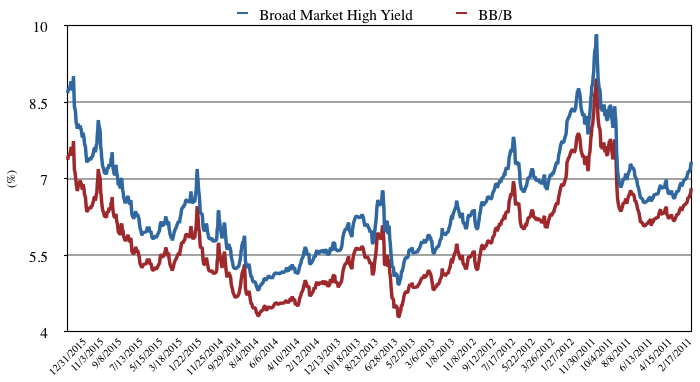
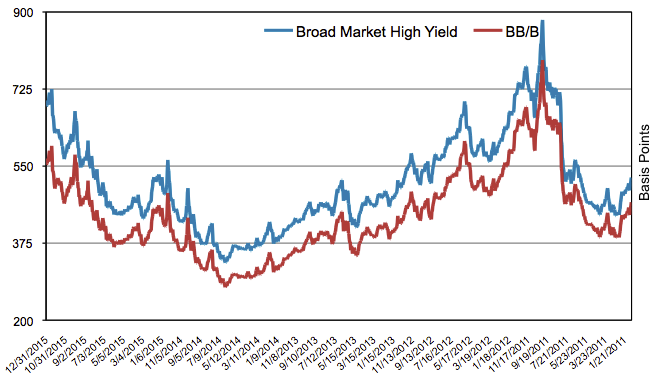
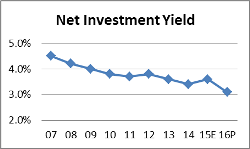
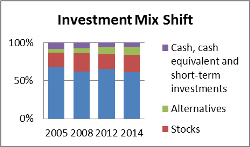
However, the prospect of lower for longer is likely to continue to pressure general account portfolio yields. This results in insurance companies increasingly reaching for yield by pushing into high yield, equities and alternatives.
| Net investment yield | Investment mix shift |
|
|
Insurance Information Institute |
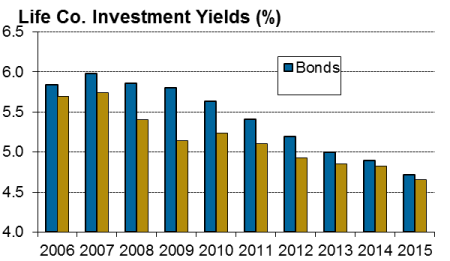
Within the life insurance space, the impact is even starker as insurers consistently struggle to meet crediting rates on long duration policies. In effect, life companies are being forced to either take greater investment risk, or gamble that an asset-liability mismatch will be corrected when rates eventually rise.
| Life Co. investment yields |
 SNL SNL |
On the liability/surplus side of life insurance balance sheets, the protracted low-rate environment increasingly puts pressure on capitalization as the low term structure of rates puts upward pressure on liability valuations. The greatest risk lies in a combination of protracted low/negative rates and asset market volatility, which raises the prospect of a double hit to capitalization through asset impairments combined with steady upward pressure on liability values.
Practical Workarounds: How Insurance Companies Operating in NIRP Regimes Have Responded
Insurance companies in Europe have been adjusting to the NIRP environment for several years, while Japan has been operating in an extreme low rate environment for nearly twenty years. The insurance industry in these countries has been forced to push for greater operating efficiency, and smaller, less efficient operators have either failed or sold themselves to larger more efficient operators. Additionally, Japanese insurance companies have increasingly engaged in overseas expansion via M&A in order to find new sources of income. However, in a world of consistently low interest rates, the scope for further geographic expansion is limited.
On the liability side of the equation, Japanese regulators have provided some relief by allowing insurance companies to use an actuarially determined rate to discount their liabilities, thus providing some capital relief from the impact of low rates. However, in a persistent low rate environment, the gap between asset returns and required returns will persist, leaving insurers vulnerable to both asset market and actuarial shocks.
What Are the Prospects for NIRP in the US?
While the consequence of implementation of NIRP in the US needs to be carefully considered, we remain sanguine about the prospects for the same. While the pace of recovery from the ‘08-10 recession in the US has been glacial, it should be noted that growth has been consistent, while unemployment has fallen below 5% (under-employment notwithstanding). However, inflation has remained below the Federal Reserve’s 2% target rate. Should inflation fall toward 0% or to an outright deflationary level, we believe the Federal Reserve would respond forcefully. However, before they resorted to NIRP, we believe they would attempt conventional policy (rate cuts/forward guidance) and other unconventional policy such as additional quantitative easing.
Conclusion
Even in the absence of NIRP in the US, we expect that the slow pace of economic growth and low inflation will result in protracted low rate environment. As such, insurance companies will continue to face constrained investment returns. In such an environment, it will be critical to avoid reaching for yield in ways that expose insurers to uncompensated risks in their investment portfolios. Insurers will also need to rationalize their expense bases and consider pricing strategy in order to bolster their balance sheets.

Written by N. Sebastian Bacchus, CFA
Senior Analyst, Corporate Credit
Disclaimer: Asset Allocation & Management Company, LLC (AAM) is an investment adviser registered with the Securities and Exchange Commission, specializing in fixed-income asset management services for insurance companies. This information was developed using publicly available information, internally developed data and outside sources believed to be reliable. While all reasonable care has been taken to ensure that the facts stated and the opinions given are accurate, complete and reasonable, liability is expressly disclaimed by AAM and any affiliates (collectively known as “AAM”), and their representative officers and employees. This report has been prepared for informational purposes only and does not purport to represent a complete analysis of any security, company or industry discussed. Any opinions and/or recommendations expressed are subject to change without notice and should be considered only as part of a diversified portfolio. A complete list of investment recommendations made during the past year is available upon request. Past performance is not an indication of future returns.
This information is distributed to recipients including AAM, any of which may have acted on the basis of the information, or may have an ownership interest in securities to which the information relates. It may also be distributed to clients of AAM, as well as to other recipients with whom no such client relationship exists. Providing this information does not, in and of itself, constitute a recommendation by AAM, nor does it imply that the purchase or sale of any security is suitable for the recipient. Investing in the bond market is subject to certain risks including market, interest-rate, issuer, credit, inflation, liquidity, valuation, volatility, prepayment and extension. No part of this material may be reproduced in any form, or referred to in any other publication, without express written permission.