U.S. financial markets posted healthy gains in 2025, shrugging off numerous unforeseen domestic and global macropolitical developments and an often-uncertain outlook. A resilient macroeconomic environment provided the conditions for these market gains and was supported by consumer spending growth, increased business investment in technology, and optimism for ongoing rate cuts from the Federal Reserve.
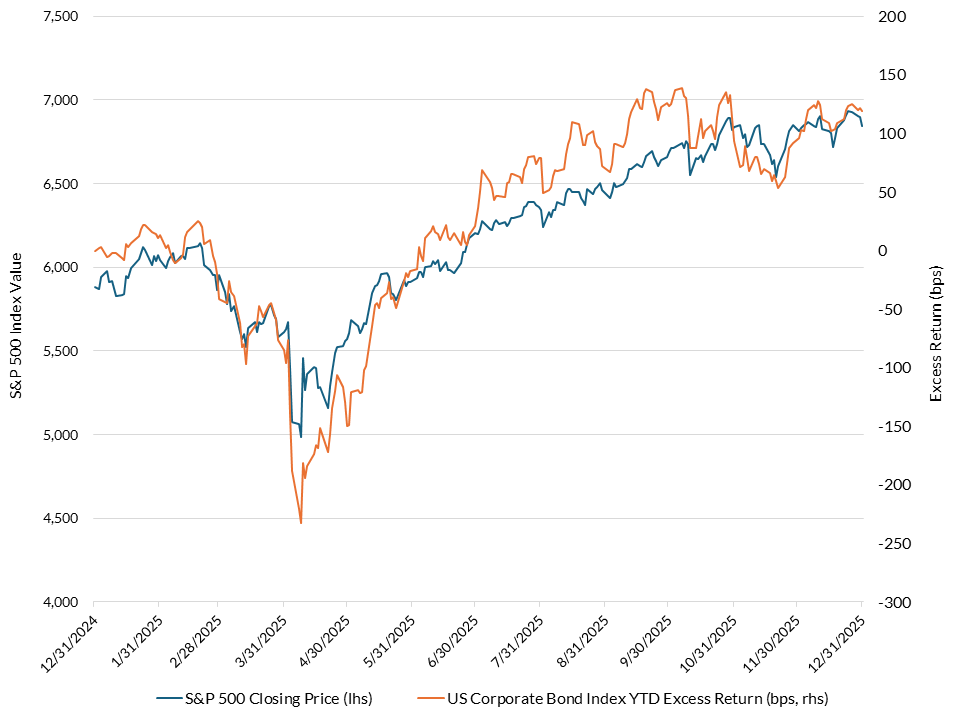
Annual periods rarely pass without volatility, and last year was no exception. Exhibit 1 below illustrates the Spring season slump endured by fixed income and equity investors alike. In addition to the rewards reaped by those willing and able to deploy capital opportunistically at improved valuations, we note the heightened correlation between bond and stock markets and the impact of sustained demand on valuations.
Exhibit 1: U.S. Equity & Corporate Bond Performance – 2025
As we turn our attention to the road ahead and our 2026 market outlook, AAM views the macroeconomic backdrop as constructive to the achievement of client investment goals: generating income and growing capital with managed risk. For insurance companies, a fourth year of gains via book yield growth and capital appreciation is expected, albeit more modest versus the trailing three-year period. While the core drivers of performance in 2025 are expected to continue, namely supportive technicals and solid fundamentals, 2026 is expected to introduce new challenges. Narrow credit spreads, Federal Reserve rate cuts, and benign inflation will likely dampen reinvestment yields and tempt fixed income investors to move out on the risk spectrum.
This is an environment that favors selectivity in pursuit of yield, diversification in management of risk, and scale to access a broad opportunity set and efficiently execute ideas. Much like our strategy in 2025, we are seeking to position public fixed income portfolios with greater exposure to securitized segments and maintain ample liquidity to opportunistically add risk if valuations improve. Within private markets, we and our investment partners strive to underwrite risk carefully in an effort to ensure that stated yields can be realized. And in equity markets, we will engage with clients to address rising concentration challenges in U.S. cap-weighted indices with strategies to broaden exposures to preserve capital gains accumulated in recent years.
2026 Macroeconomic Outlook
Executive Summary
AAM’s U.S. economic outlook for 2026 is centered around three core themes: trend-like GDP growth; moderating but not low inflation; and a gradual easing of monetary policy. The risk of a recession remains low supported by consumer spending and business investment. While inflation is expected to move lower, it is likely to remain above the Federal Reserve’s 2% target. Against this backdrop, the Fed, which is focused on slowing job growth, is expected to deliver two to three 25 basis point rate cuts by the end of 2026.
Theme 1: Trend Growth, No Recession
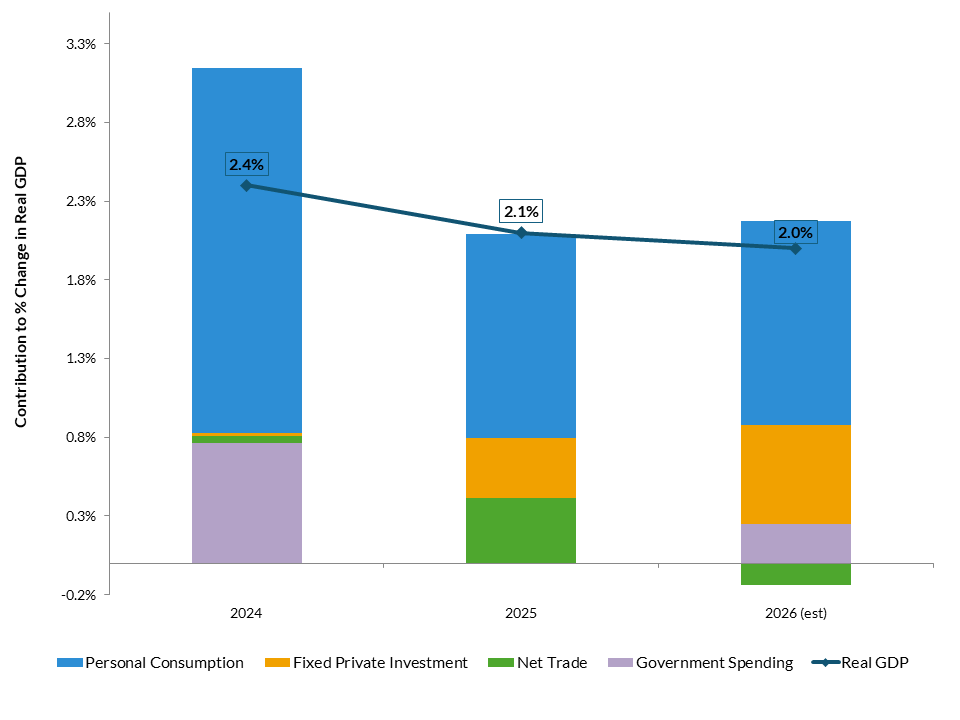
We expect economic growth in 2026 to be in line with the consensus forecast of 2.0%1, supported by easing financial conditions, relatively strong household balance sheets, and favorable tax policies. As shown in Exhibit 2, personal consumption is expected to remain the key driver of growth, supported by rising real disposable income and positive wealth effects. Spending will be driven mainly by middle- and higher-income households, as lower-income consumers remain under pressure from elevated food and rent costs, higher debt-service burdens, and reduced fiscal support. A key risk for the consumer is a softening in the labor market leading to slower wage growth. Business investment, particularly in AI, is expected to contribute more to overall growth in 2026, while net trade is projected to be a slight drag. With risks to GDP growth appearing balanced, AAM views the probability of the U.S. entering a recession in the near-term to be low.
Exhibit 2: Contribution to GDP Growth2
Theme 2: Moderating inflation remaining above the Fed’s target
Inflation is expected to keep declining in 2026, but is likely to remain above the Federal Reserve’s 2% target throughout the year. This decrease is mainly driven by easing shelter inflation, balanced demand, and minimal supply chain pressures. The latest S&P/Case-Shiller index shows home prices increased by 1.4%3 year-over-year, down from a 3.6%4 rise in the previous twelve months. The “stickiness” in inflation, which we believe will prevent it from reaching the Fed’s target, is primarily driven by tariffs and tighter immigration policies. On the tariff side, the potential for continued pass-through effects could push core goods prices higher in the near term. Stricter immigration policies should help support wage growth and limit any significant reduction in services inflation.
Theme 3: Monetary policy to ease but remain tight by historical standards
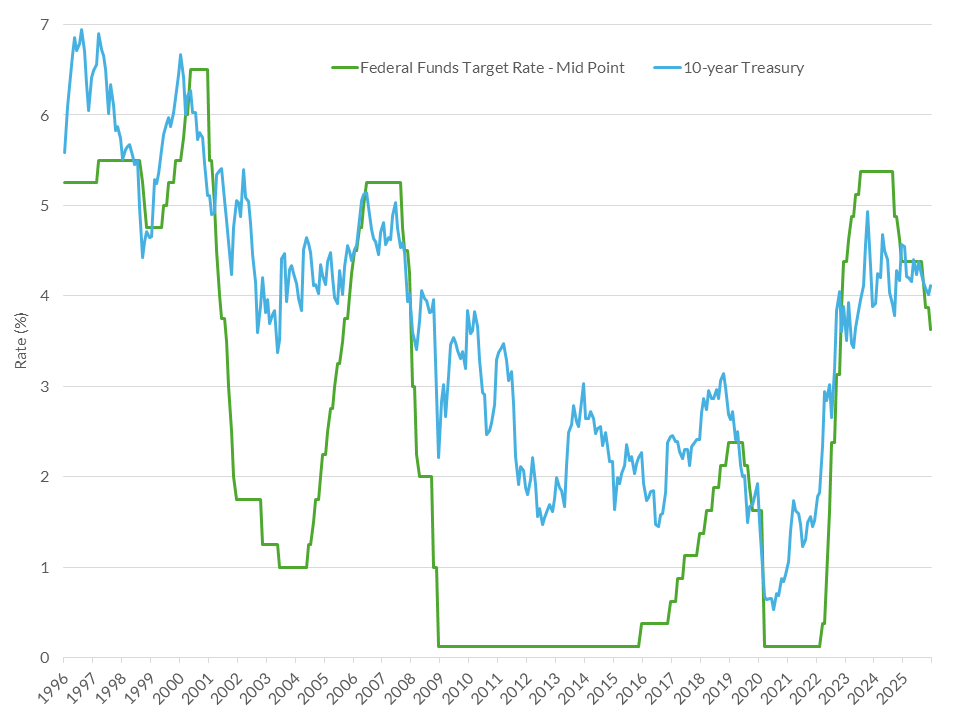
By the end of 2026, we expect the Federal Reserve to reduce the Fed Funds rate down to around 3%. As shown in Exhibit 3, this would still leave the rate well above the terminal levels seen in previous easing cycles. Given the ongoing uncertainty around inflation and a labor market that hasn’t yet seen a major increase in layoffs, the Fed is likely to remain cautious in delivering additional stimulus. President Trump’s choice to replace Chairman Powell is expected to be more dovish, which could lead to additional rate cuts, provided the new chair can build consensus among the voting members. We expect long-term rates to stay range-bound due to elevated inflation and the need to finance budget deficits, with the 10-year Treasury yield ending the year near 4%. This is likely to result in a steeper yield curve as short-term rates follow the Fed Funds rate lower.
Exhibit 3: Fed Funds & 10-Year Treasury Rates
Investment Grade Fixed Income
The 2026 outlook across investment-grade corporate bonds, structured products, and municipal markets is broadly stable but increasingly selective, with muted return expectations and a heightened focus on credit quality and sector dispersion. We expect the new issue market to be a source for outperformance in markets in 2026. A broad opportunity set will be important in addition to flexibility and diversification, as investors seek outperformance in a more challenging environment5.
In corporate credit, spreads are expected to widen modestly as fundamentals deteriorate in line with late-cycle dynamics – higher leverage, margin compression, and slowing growth. While rating activity was largely positive in 2025, we expect that trend to normalize and begin to reverse as we enter later stages of the credit cycle.
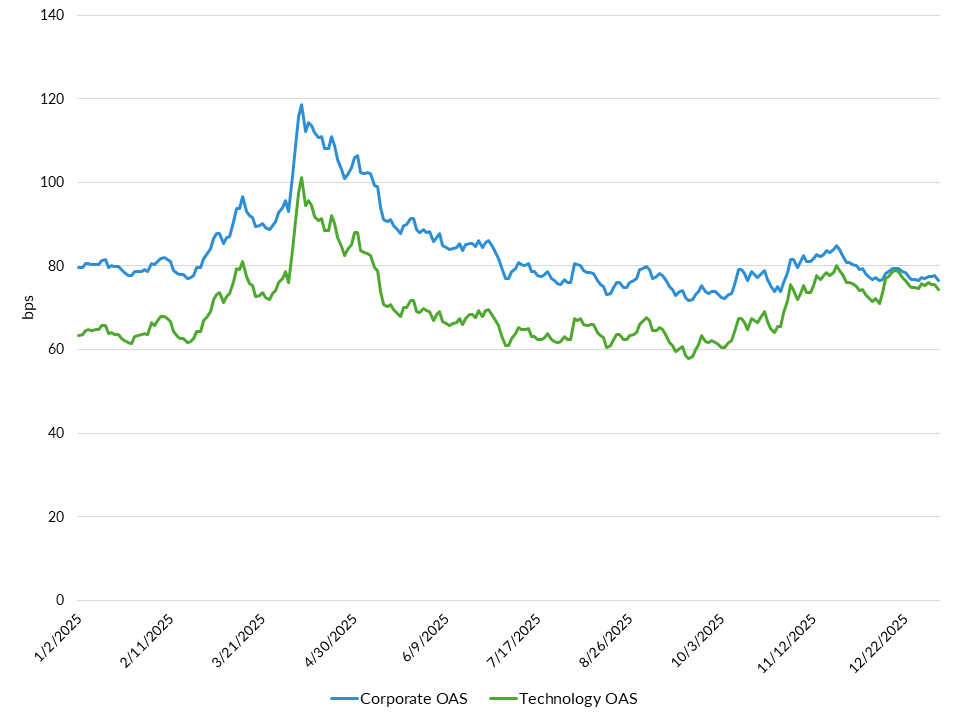
While technicals remain supportive, sector and security selection will be critical to drive performance. Sectors such as Autos, Integrated Energy, Pharmaceuticals, and Utilities are favored for their strong fundamentals and relative value, while Technology and Finance face pressure from AI-driven capital spending and private credit concerns. Consumer sectors are challenged by slowing spending and tariff impacts, but autos and retail maintain healthy, if cautious, growth. Healthcare and financials benefit from solid fundamentals and supportive macro trends, though regulatory and technical factors drive issuer-level dispersion. We expect security selection to drive performance next year, as we started to witness later in 2025 with Technology a prime example.
Exhibit 4: Technology Spreads Widen and Underperform the Corporate Market
Structured products outperformed Treasuries and corporates in 2025, led by Agency MBS, but 2026 is expected to bring more muted returns as spreads normalize and technical supply challenges emerge. Agency MBS should benefit from stable rates and low prepayment volatility, though increased supply will test market absorption. ABS spreads remain attractive, with tighter underwriting and higher disposable income supporting credit quality, but sector selection is key—favoring equipment, aircraft, and mid-prime auto issuers while avoiding riskier data center securitizations. CMBS faces refinancing risks, especially in office properties, but diversified pools and shorter maturities offer competitive yields. CLOs are likely to underperform amid Fed rate cuts and record supply, with senior tranches expected to widen. Overall, disciplined credit selection and a focus on high-quality, well-capitalized issuers are essential as investors navigate a more challenging and differentiated landscape in 2026.
The municipal market enters 2026 with a mixed outlook. The tax-exempt sector appears unattractive for institutional investors due to expensive relative valuations and another year of record new issuance, as illustrated in the exhibit below.
Exhibit 5: Municipal Bond Supply Since 2005 ($ Billion)
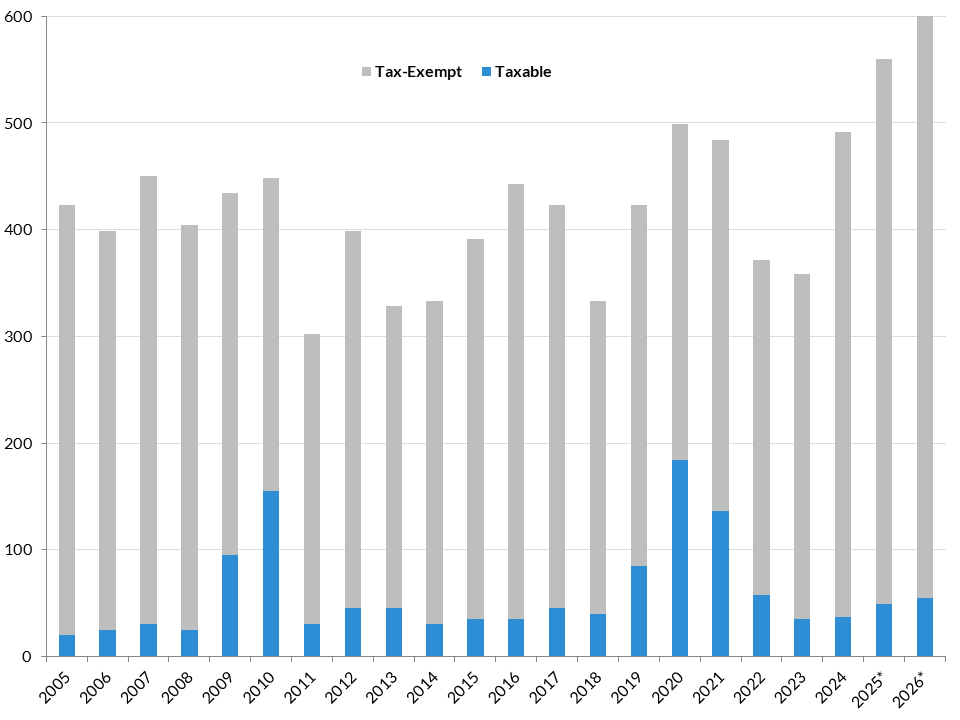
This supply technical is expected to remain a headwind. Despite stable state and local government credit fundamentals and strong reserve positions, the tax-adjusted yield disadvantage persists, making tax-exempt municipals less appealing for portfolios subject to a 21% corporate tax rate. In contrast, the taxable municipal sector is viewed more constructively, supported by normalized spreads, manageable supply, and stable fundamentals. Higher education remains a focal point, with the strongest institutions demonstrating resilience despite ongoing policy and funding pressures. Overall, the recommendation is to favor taxable municipals over tax-exempts for institutional portfolios in 2026.
Private Credit
Perhaps no market has drawn more attention than the Private Credit sector, which encompasses both Investment Grade and leveraged Direct Lending strategies.
Within the traditional Investment Grade portion of private credit markets, the economic backdrop for 2026 is expected to bode well for fundamentals, with stable credit metrics across most sectors. Hints of weakness and high-profile defaults within lower-quality markets appear isolated thus far and have not broached the Investment Grade traditional private placement market.
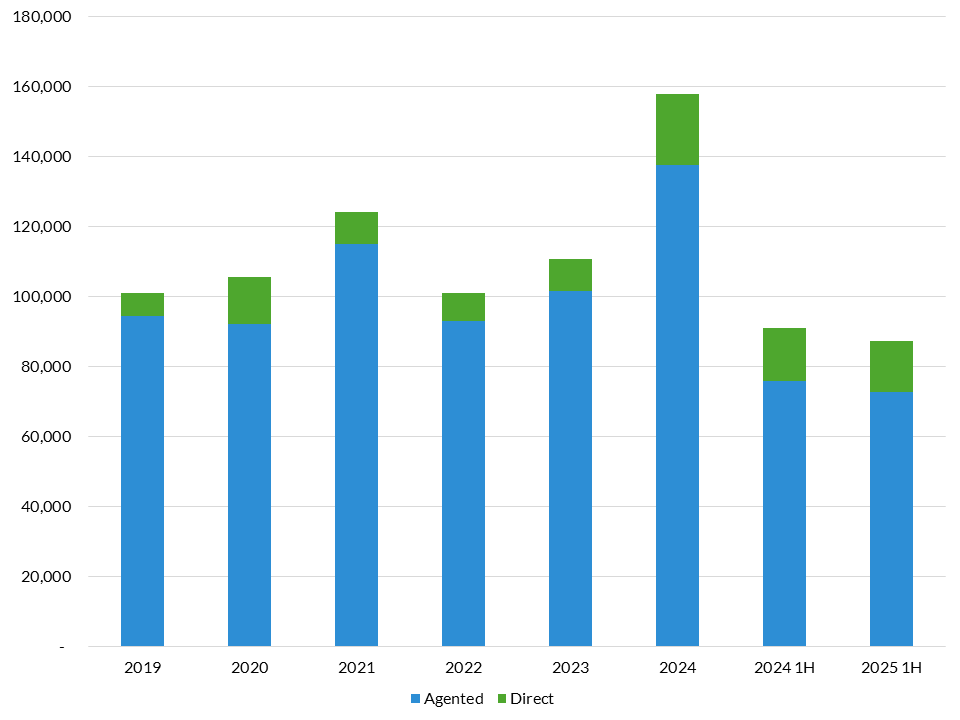
Supply and demand technicals in the traditional portion of the Private Credit market are supportive, with 2025 primary market volume well over $100 billion, similar to 2025’s record year, as illustrated in Exhibit 6. The pace of issuance is expected to be similar to start 2026. Investor demand has been strong, with most deals oversubscribed and instances of failed deals extremely rare. Traditional life insurance companies continue to dominate demand given appetite for incremental yield, but the market is seeing new entrants including pension managers and potential retirement plan access to the market. Infrastructure issuance to finance AI projects may put upward pressure on supply and widen risk premia but is likely to be met with demand where clean structures and creditworthy guarantors are involved. Direct deals continue to be a more meaningful and growing segment of the private placement market.
Traditional Private Credit spreads continue to track public corporate markets, which are at historically tight levels. However, the spread advantage to public corporates continues to offer reasonable relative value for the illiquidity.
The sector, and the positive carry versus Investment Grade public credit, is likely to contribute favorably to returns for client portfolios with the appetite for illiquidity.
Exhibit 6: Private Placement Volume ($ Millions)
Commercial Mortgage Loans
Commercial Real Estate fundamentals continue to remain on solid footing, with valuations benefitting from a generally downward trend in interest rates throughout 2025. The Multi-Family sector has benefitted from constrained housing supply in many regions and generally supportive rent growth. However, investors view Multi-Family as a safe haven, and have pushed valuations to rich levels leading to reduced opportunities in the near term. Within central business district Office markets, we observe improvement in New York and San Francisco with a continued bifurcation of Class A outperforming, with Class B and C properties lagging. We think this continues into 2026. Industrial Properties continue to have balanced supply and demand, leading to stable conditions and Net Operating Income. Data centers are expected to continue a rapid growth phase with the emergence of cloud computing and AI needs. We expect continued improvement in Retail markets, especially in grocery-anchored properties in affluent suburban markets.
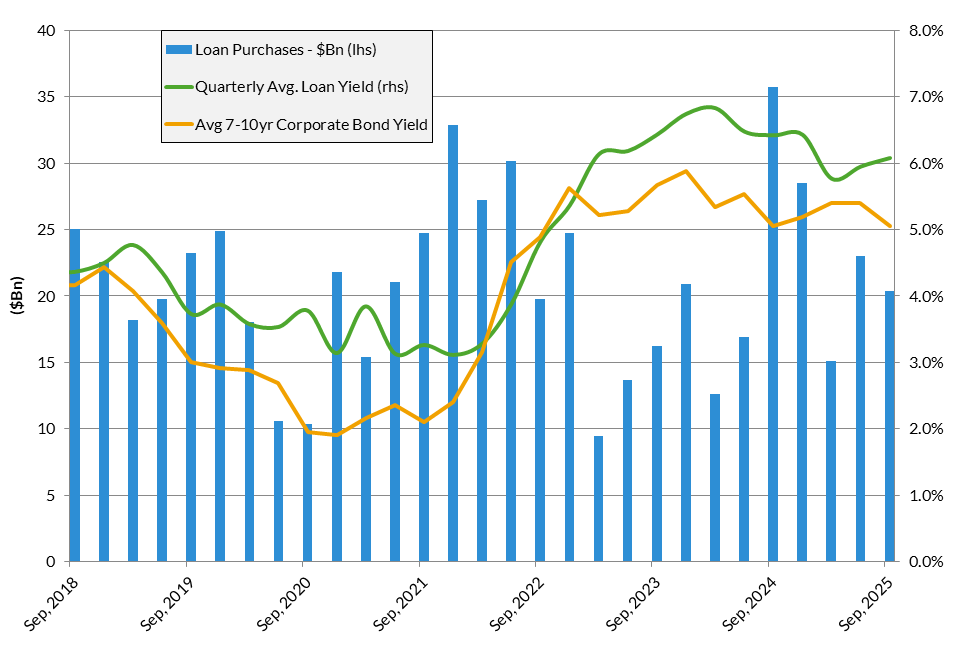
Loan supply is healthy, though many borrowers remain reluctant to lock in traditional ten-year funding, preferring to wait for lower rates down the road. As a result, supply continues to be weighed towards maturities in five years, a trend likely to continue through 2026. Insurance demand remains strong as shown in Exhibit 7, with yields of 5.75% – 6.00% for loans that meet investment grade quality standards, using NAIC metrics. Prepayment protections in loan agreements makes the asset class attractive for writers of fixed rate annuities. While yields are down from early 2025, they are attractive by historical standards. The yield advantage versus corporate and securitized bonds, along with healthy fundamentals, leads us to a favorable view of the sector with particular focus on Retail, Self-Storage, and Industrial property types.
Exhibit 7: Insurance Loan Origination Volume & Yield History
Below Investment Grade Credit
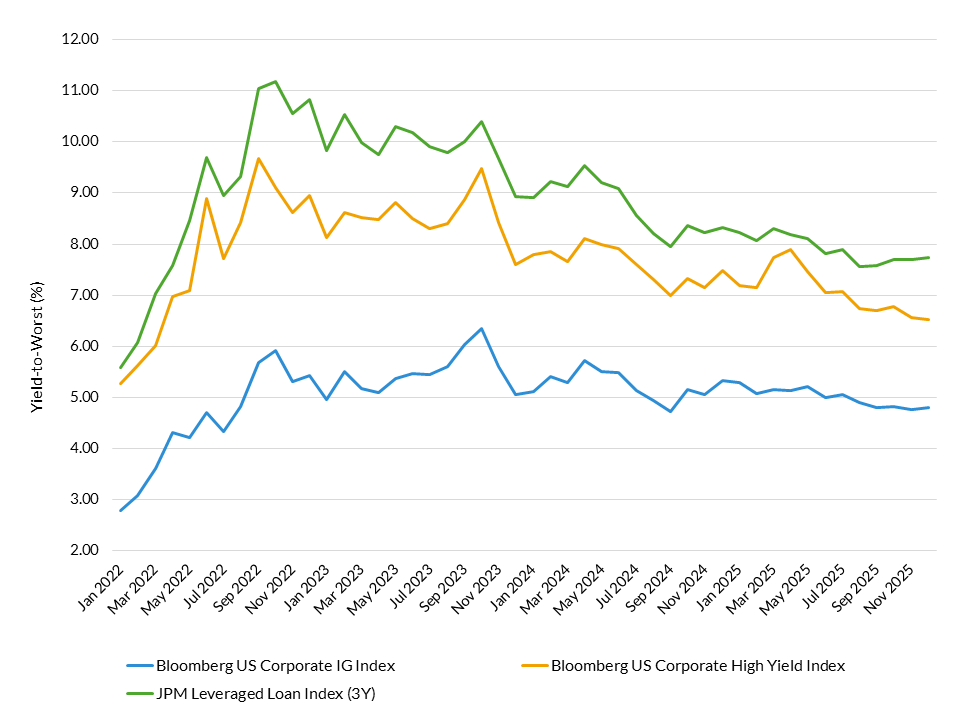
High yield credit markets enter 2026 with solid fundamentals as corporate earnings remain sound, margins are healthy, and balance sheets continue to reflect stable credit quality. Net leverage for the high yield bond market ended the year under 4.0x with par defaults for bonds and loans around 2.2%6. Importantly, no broad deterioration in credit quality is expected, and this ongoing strength in fundamentals underpins a constructive—though disciplined—view on credit heading into the year. Spreads remain tight (281bps7) and historically compressed, with risk premia having narrowed across ratings, debt tiers, and sectors. While this limits scope for further spread compression, it reinforces an environment in which returns are likely to be driven by carry rather than price appreciation. Despite lofty valuation, high yield continues to offer meaningful yield pick-up versus the investment grade market (see chart below).
Any curve steepening is more likely to be driven from the front end as policy rates fall, given that long-end yields are expected to remain anchored around current levels. In this context, a barbell strategy—favoring short-dated exposure alongside selective 7–10-year maturities—remains well aligned with the prevailing rates and volatility backdrop. The U.S. high yield market now exhibits its shortest duration to maturity on record (2.91 as of year-end8), enhancing resilience to rate volatility. This may lead to weaker technicals as markets will have to digest increased supply, as around 9% of the HY bond market is due to mature within the next two years, and M&A activity is expected to pick up. Notably, any widening in spreads is expected to be contained, with estimates in the 25-80bps range9. On the loan side, net issuance is expected to fall as higher M&A supply will be countered with lower refinancings. Despite this technical tailwind, discount margins are expected to increase in a similar fashion10 to bonds with Fed-driven decay in coupon carry softening retail demand.
Exhibit 8: Loan Yields Remain Elevated While High Yield Outperformed in 2025
Convertible Bonds
U.S. convertible bonds exited 2025 as one of the best performing asset classes, with the Bloomberg U.S. Convertible Bond Index returning 17.8%, outpacing traditional fixed income and matching equity markets. The Bloomberg U.S. Convertible Balanced Bond Index, which reflects the classic balanced profile used by many active managers, returned 15.4%11. Convertibles’ structure, which combines downside protection through its bond floor and with equity participation through its conversion feature, drove performance through last year’s tariff volatility and subsequent equity recovery. In 2025, convertibles participated in 54% of their underlying stock’s upside appreciation but only participated in 43% of the downside returns12.
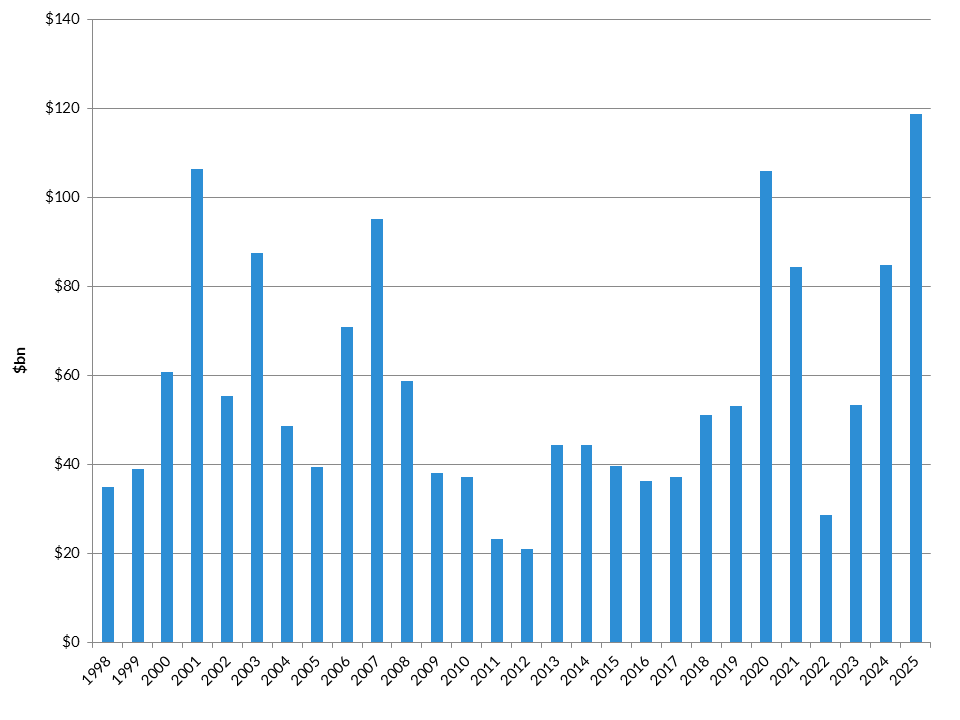
2025 was a historic year for new issuance in the US as it reached a record $119 billion across 150 deals. Conditions that fueled supply, including record equity prices, low financing costs, AI-related funding needs, and a refinancing pipeline, are expected to continue into 2026 and deliver additional balanced supply to the market. On the latter point, 43% of the U.S. convertible market matures over the next three years, with $45 billion expected to mature in 2026.
Exhibit 9: US Convertible Issuance ($bn)
AI linked issuers have quickly become a focal point of the convertible universe, creating both compelling upside and growing risk. These issuers include those funding AI infrastructure (data centers, servers, power and related networking assets) as well as those building AI platforms and applications. These names not only contributed meaningfully to last year’s record primary market activity by issuing $28 billion but also fueled overall performance. AI-linked convertibles, 16% of the U.S. market, returned roughly 52% YTD through November 19th compared to the overall market’s 15% return13. While these issuers’ elevated volatility profile can help drive convertible’s upside capture, there is downside risk if AI bubble worries manifest as these names have higher leverage and lower profitability when compared to the broader convertible market.
As we look to 2026, there are good reasons to believe the market’s positive trajectory is likely to continue. Our team believes that equity markets, a key driver of convertible performance, should benefit from ongoing economic growth and an accommodative Fed. Volatility remains elevated at the single name level relative to indices, reinforcing the value of the embedded equity option and providing a supportive environment for actively managed strategies. Additionally, robust issuance should add balanced names to the opportunity set, and the AI trade continues to present compelling return prospects. Still, there are risks to this optimism. Even though default rates are low and IG rated issuance is growing, AAM’s outlook for modest weakening in credit spreads could weigh on valuations. Additionally, potential “AI bubble” deflation and tighter monetary policy from reaccelerated inflation remain key risks. Despite these dangers, the unique structure of equity participation and bond floor protection remains their greatest advantage.
Equities
As we enter 2026, U.S. equity markets appear set to extend the bull run that started in Q3 2022, supported by expectations of positive economic growth, continued earnings expansion, and an accommodative Federal Reserve. We note, though, that the exuberance of the last three years is increasingly tempered by renewed focus on valuations, diversification, and discipline.
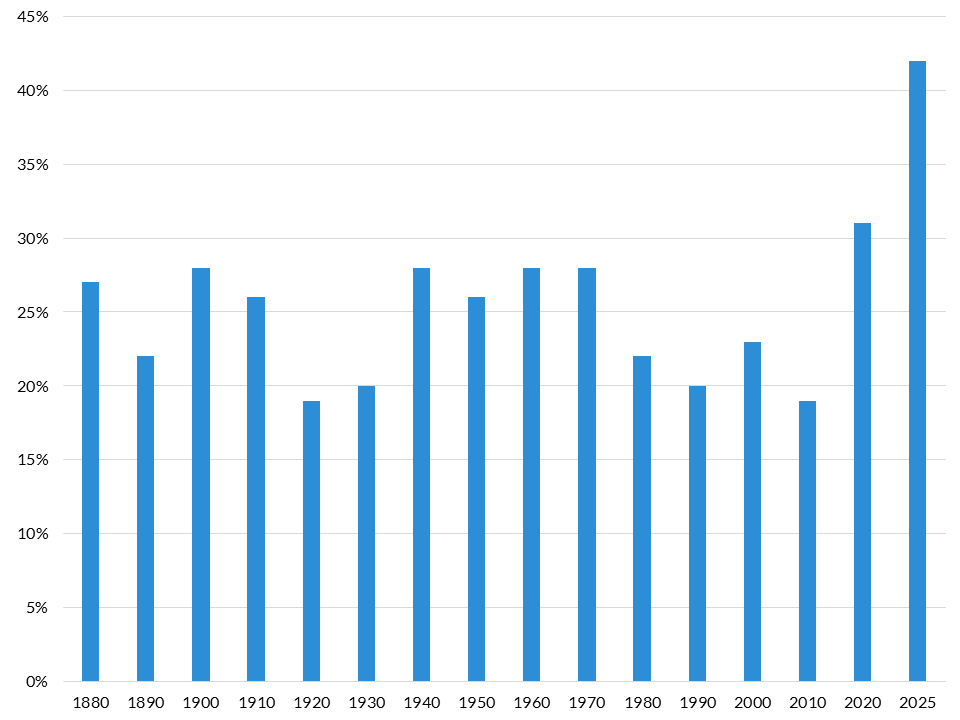
Exhibit 10: 10 Largest Companies as % of S&P 500 Index
Diversification Challenges
As illustrated by the graph above, capitalization weighted U.S. equity market indices are highly concentrated in a handful of issuers. This poses challenges to passive investors seeking diversified, broad market exposure. Passive indexing now represents a high-conviction wager on the Tech/Communications sector, which has delivered tremendous gains but also incorporates aggressive growth expectations into current prices. This concentration has increased the relative volatility of cap-weighted indices; as enthusiasm for AI exposure temporarily cooled in early November 2025 the S&P 500 fell 5.1%, while the equal-weight version of the index declined just 3.3% in the same period.
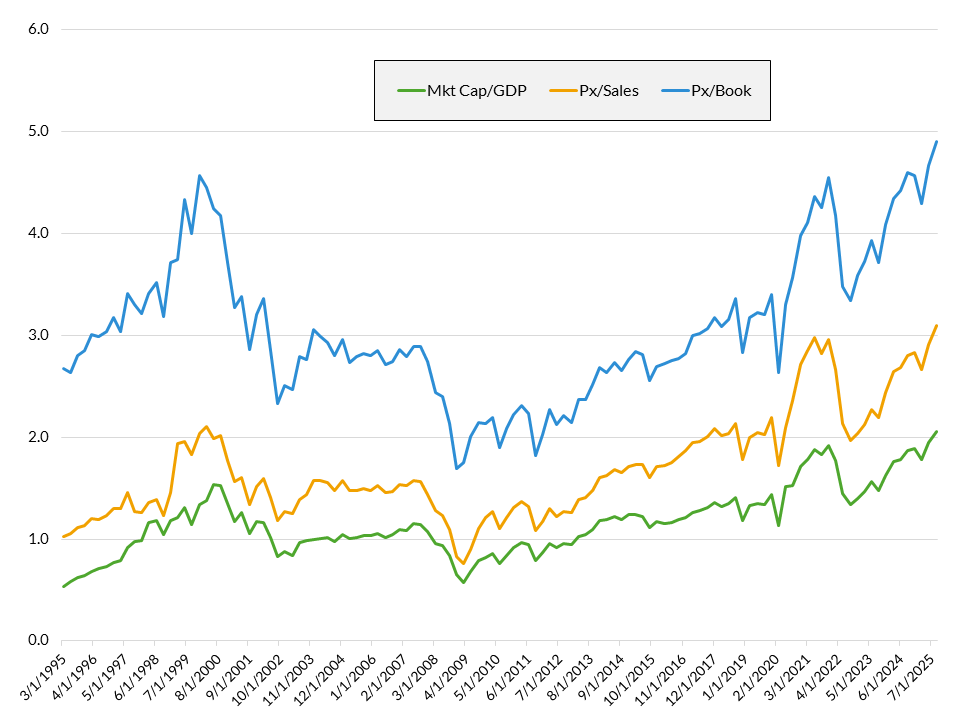
Exhibit 11: Russell 3000 at Record High Valuations
Valuation Concerns
Valuations within U.S. equity markets remain a critical risk factor. Measures including Price/Sales, Price/Book, and Market Cap/GDP, indicate US equities have never been more expensive than they are today. While such measures have historically exhibited significant negative correlation with subsequent long-term returns, periods of high valuation can persist and provide limited explanation for subsequent one year market performance. At most they reflect the potential for significant downside if a strong negative catalyst appears. But it bears emphasizing that high valuations are a long-term risk factor, not a sign to reflexively reduce exposure today.
Expectations & Positioning for 2026
Large tech firms with large language model (LLM) exposure have driven US equities sharply higher for three years in a row, achieving an unprecedently high share of total US market cap. This concentration entails greater potential for volatility, and new developments on this theme (whether positive or negative) will likely be key drivers of 2026 performance. Ultimately we expect positive US equity returns for the year, though perhaps less extreme and less concentrated than the 22.2% average annual return of the past 3 years. We expect renewed investor interest in non-tech sectors facing their own tailwinds, such as financials benefiting from a steepening yield curve, or pharma companies continuing to refine and broaden the applications of GLP-1 drugs. Meanwhile, looser Fed policy and favorable fiscal policy are supportive of healthy consumer spending, as are recent positive surprises in GDP growth and employment. We also expect US equities to resume their leadership over international (e.g., EAFE) markets, as the tariff turmoil that led to performance divergence early last year recedes further. We recommend broadening exposures away from mega-cap tech, which has reached extreme levels of market concentration to the point of obscuring other opportunities. This could include shifting marginal investment flows to dividend-focused equities, or reallocating a portion of exposure to cap-weighted index funds into equal-weighted alternatives. While broadly elevated valuations are worth keeping an eye on, that is a risk best managed through traditional tools of diversification, periodic rebalancing, not timing markets, and not chasing performance in hot sectors. With a disciplined approach, equities should continue to serve as a crucial source of surplus growth for insurance investors in 2026.
1 Bloomberg Forecasts, Q4/Q4 estimate
2 Q4 2025 GDP growth projected at 1.0% based on Bloomberg Forecasts
3 Case/Shiller as of October 2025
4 Case/Shiller as of October 2024
5 J.P. Morgan Research, Bloomberg L.P.
6 Inclusive of loan-management exercises; BAML HY Credit Chartbook 12/31/2025
7 ICE Bof A US High Yield Index as of 12/31/2025
8 ICE Bof A US High Yield Index duration-to-worst
9 High yield YE2026 spread forecasts vs YE2025: BAML: +25bps / JPM: +30bps / DB: +79bps
10 Bank of America Merrill Lynch Research
11 Bloomberg
12 BofA Research
13 BofA Research


Utilities: Affordability Takes a Prominent Role in an Active Political Year
February 9, 2026