Q3 and YTD equity performance across global equity sectors has shown a remarkable degree of divergence, driven by a complex interplay of monetary policy expectations, geopolitical shifts, and the continued dominance of specific, high-growth secular themes. For insurers holding diversified equity portfolios via index ETFs, understanding the factors behind these differences is key to evaluating portfolio positioning.
Exhibit 1: Equity Index Returns
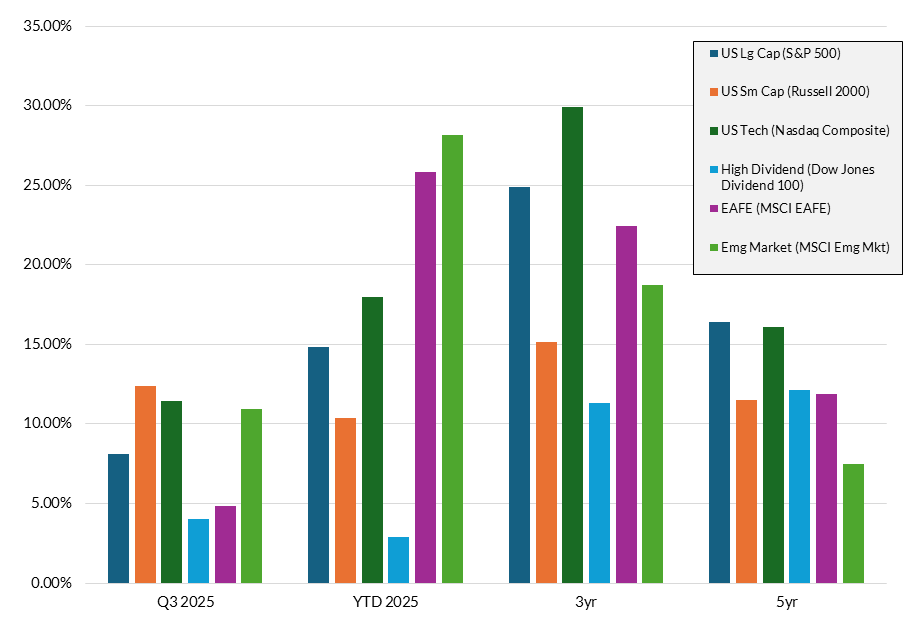
Here’s a recap of performance and key themes for a selection of equity sectors and geographies:
US Large Cap
Performance: US Large Cap equities (S&P 500) continued their robust upward trend in Q3, extending strong YTD gains. While performance was impressive, the index’s returns lagged international counterparts YTD, a notable change from most recent years.
Key Drivers:
AI/Technology Dominance: The primary engine of US Large Cap growth remains the concentrated strength of a few mega-cap companies. Optimism surrounding the continued development and monetization of Artificial Intelligence (AI) has led to substantial earnings growth and multiple expansion for these firms, skewing overall index performance. This effect is more visible when comparing YTD returns in the tech-focused Nasdaq Composite (+18.0%) vs the value-weighted Dow Jones Dividend 100 (+2.9%). Extraordinary growth in AI-focused names has obscured tepid performance elsewhere.
Corporate Earnings Resilience: Large US corporations continued to report solid earnings, often exceeding tempered expectations, supported by efficiency gains and a resilient US consumer. While companies have become more cautious about adding to payrolls given rising macroeconomic unpredictability, the unemployment rate remains low and interest rates have tapered off their recent highs, supporting consumer strength.
Monetary Policy Pivot: Initial signs of a Federal Reserve “dovish pivot”—a shift toward deeper-than-expected interest rate cuts—supported a broad market rally, though the impact was more pronounced in the Small Cap space late in the quarter.
US Small Cap
Performance: US Small Cap stocks (Russell 2000) staged a significant rally in Q3, marking a strong outperformance relative to Large Cap for the quarter. On a YTD basis they trail by nearly 5% however, having had a challenging start to the year.
Key Drivers:
Interest Rate Sensitivity: Small Cap companies typically carry higher debt loads, making them acutely sensitive to interest rate changes. The recent shift in monetary policy outlook—specifically, the prospect of near-term rate cuts—provided a powerful tailwind, fueling healthy gains as lower future borrowing costs were priced in.
Profit Recovery: After a prolonged period of subdued earnings, Small Cap companies began to show signs of a profit recovery in the first half of the year, with Q3’s momentum being further reinforced by this long-awaited improvement.
Economic Cycle Position: Small Cap stocks are highly sensitive to the domestic US economy. The relative resilience of US economic growth, despite global headwinds, provided a supportive backdrop.
Developed International (EAFE)
Performance: EAFE (Europe, Australasia, and the Far East) equities delivered impressive returns in Q3 and maintained a leading position on a YTD basis, outperforming US Large Cap stocks for the period.
Key Drivers:
US Dollar Weakness: The most significant factor for US-based investors was the weakening of the US Dollar (USD) against a basket of foreign currencies. This currency tailwind amplified returns for US investors holding foreign assets, directly boosting the value of EAFE returns.
Valuation Catch-up: EAFE stocks began the year trading at a significant discount to US equities on a variety of valuation metrics. The strong performance in Q3 represents a degree of valuation catch-up, as international markets became relatively more attractive to global capital.
“Value” and “High Dividend” Leadership: In sharp contrast to the US market, Value and High Dividend stocks have been primary drivers of EAFE outperformance, largely due to better-than-expected earnings and policy tailwinds in specific countries (e.g., corporate governance reforms in Japan).
Emerging Market (EM)
Performance: Emerging Market equities experienced a late surge in Q3, pushing their YTD performance to a level competitive with EAFE, decisively outpacing US Large Cap.
Key Drivers:
Strong Dollar Weakness Benefit: Similar to EAFE, the depreciating US Dollar was a major catalyst. A weaker dollar makes dollar-denominated debt cheaper for EM governments and corporations and increases the competitiveness of their exports.
Economic Dynamics: While global growth is uneven, many Emerging Market economies benefit from favorable demographics and a growing middle class, translating to strong domestic demand.
Inflation and Rate Cycle: Many EM central banks had proactively raised interest rates earlier than the US Fed to combat inflation. This earlier action allowed some EM central banks to start easing monetary policy sooner, boosting local stock markets.
Commodity Price Support: Higher commodity prices, driven by geopolitical risk and sustained global demand, provided a significant boost to commodity-exporting EM nations.
Conclusion
The stark differences in sector performance come down to three core drivers:
Monetary Policy Expectations: The anticipated end of the Fed’s tightening cycle and the prospect of future rate cuts acted as an accelerator for interest-rate-sensitive US Small Cap stocks and reduced the appeal of US High Dividend sector.
Currency Effects: The unexpected weakening of the US Dollar provided a massive boost to both EAFE and Emerging Markets, translating local returns into significantly higher USD returns for US investors.
AI Enthusiasm: The highly concentrated, company-specific nature of the AI-led rally meant that US Large Cap indices, while strong, remained narrow. In contrast, the performance of EAFE and EM was much broader, driven more by macroeconomic fundamentals.
Please reach out to your Portfolio Management team if you’d like to learn more about how these equity themes are impacting your investment strategy and performance.