
Fixed Income Summary
By Elizabeth Henderson, CFA
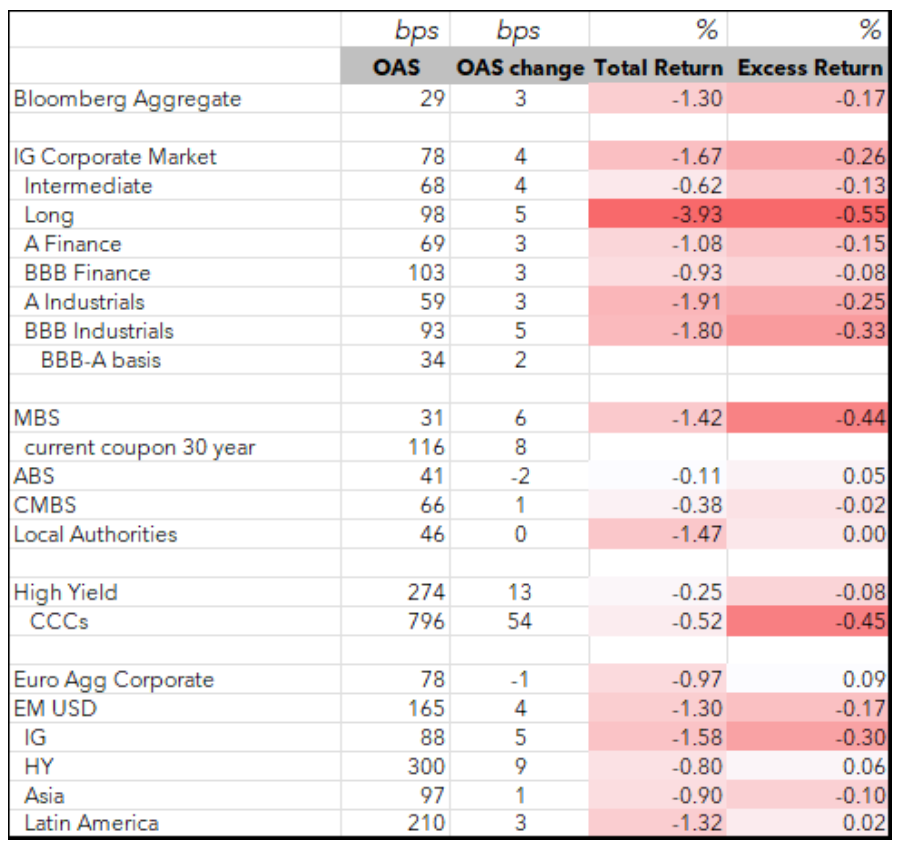
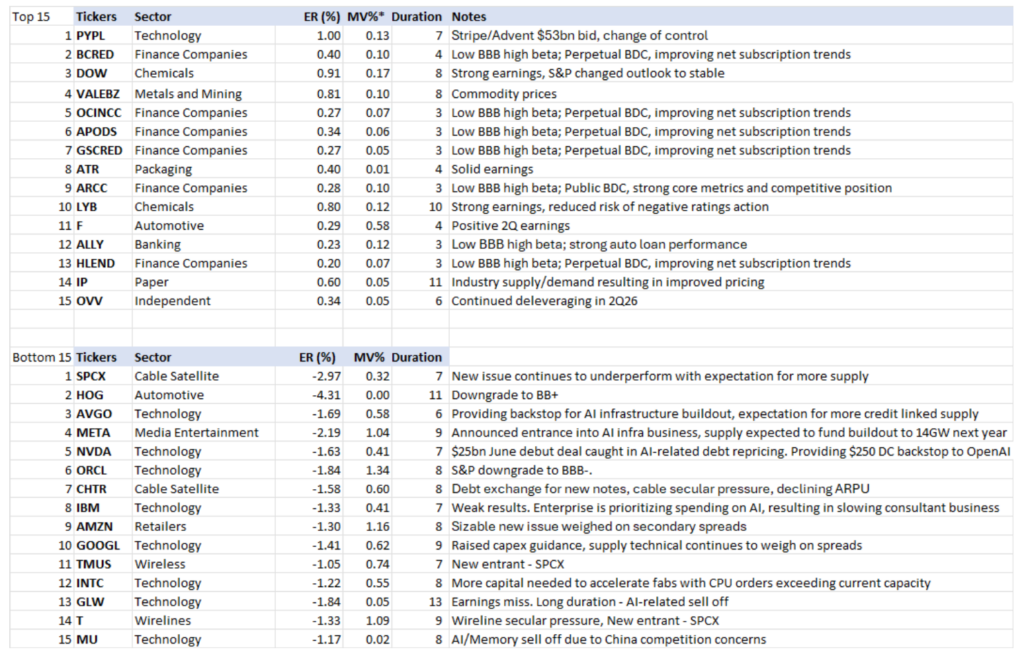
Investment grade fixed income markets faced a more challenging backdrop during July as higher rates, a steeper Treasury curve, FOMC uncertainty, and broader global macro volatility weighed modestly on spread sectors. Total returns were negative across most fixed income asset classes given the move in rates. Corporate credit generally remained resilient, as the OAS was only 4 bps wider, with AI-related debt underperforming. Technology debt issuance set a monthly record in July. Structured product performance lagged prior months, driven primarily by agency RMBS weakness, while CMBS and ABS demonstrated relative resilience despite ongoing issuance activity. Higher all-in yields were supportive for IG spreads in July and should support demand into the fall.
IG Fixed Income Recap
Corporate Market
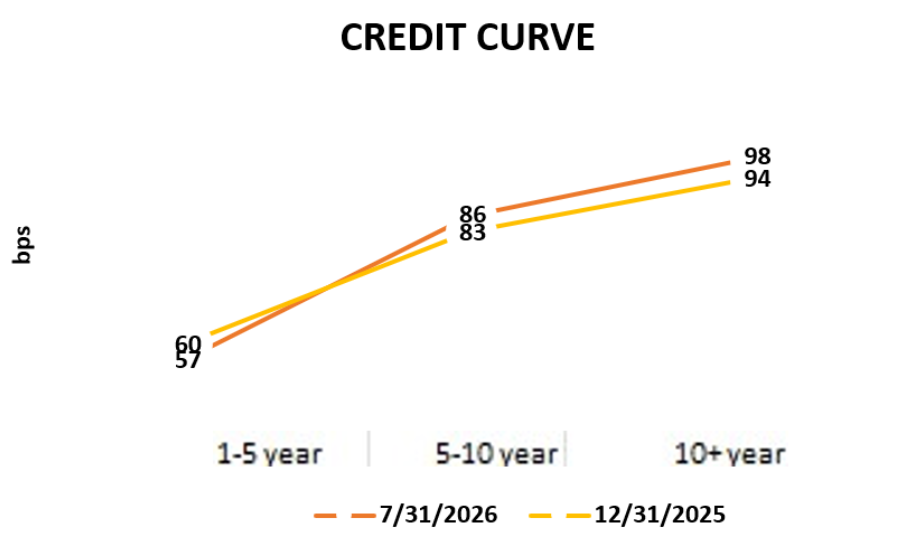
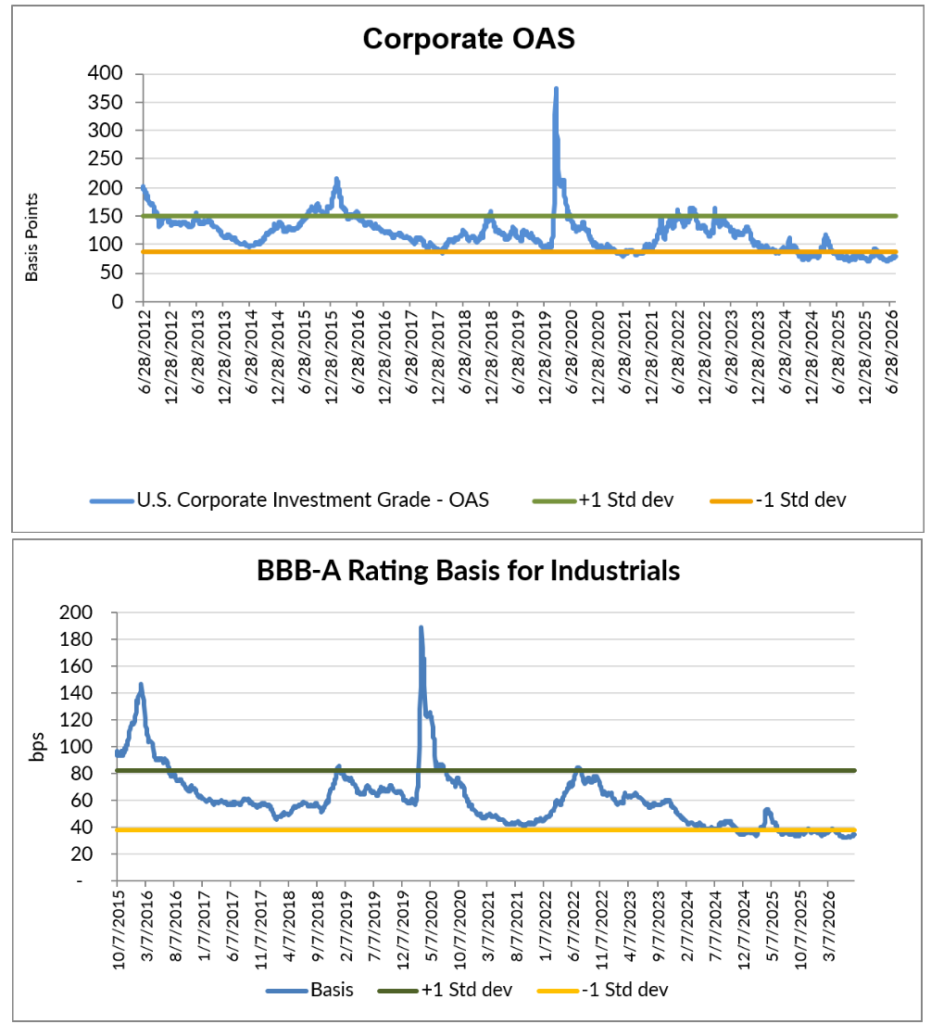
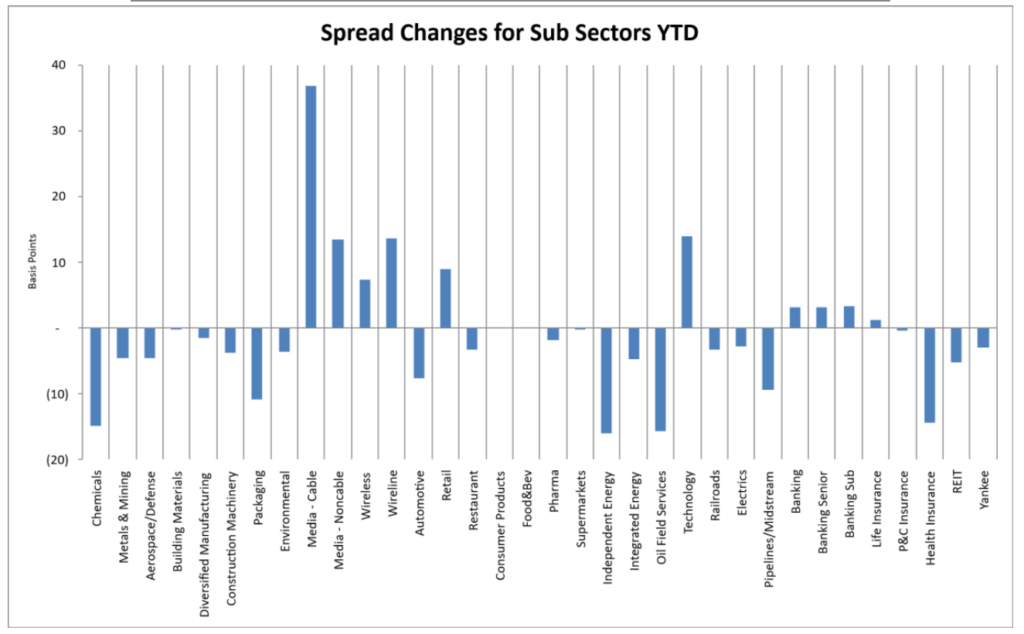
Corporate spreads widened in July, the weakest monthly spread performance since February 2026. Financials outperformed Non-Financials, as AI-related issuers underperformed due to heavy new issue supply. The dispersion was highly concentrated, as the hyperscaler cohort widened approximately 27 bps on the month while the market excluding those issuers was only about 5 bps wider (using JULI index per JPM). Outside of Technology and Media, the more cyclical, economically sensitive parts of the Industrial complex held up best. Sectors levered to the consumer, higher commodity prices, and a strengthening manufacturing backdrop outperformed. The rating spread between BBB and A rated Industrials remains historically tight at 34 bps.
Looking at sectors relative to Industrials (Sector OAS/Industrial OAS):
• Z scores >1.5: Cable, Technology, Life Insurance, Retail, Wireline
• Z scores <-1.5: Metals & Mining, Environmental, Independent Energy, Midstream, Aerospace & Defense, Restaurant, Pharma, Packaging, Building Materials, Diversified Manufacturing, Consumer Products, Rails
Source: Bloomberg, AAM (bold=new for the month; strike-through = no longer valid vs last month; 5+years unless noted for last twelve months)
Corporate Market Technicals and Rating Changes
High grade supply in July totaled $141B, the busiest July on record and 44% above the four-year average. Technology was the driver; the second-largest month ever for gross Tech supply. Year-to-date supply of $1.3T is up 34% year-over-year. Bonds issued during July outperformed the market.
Demand remained solid but moderated. High grade mutual funds and ETFs took in $32B during July versus $42B in June. Average daily trading volume was $45B, while 19% of high-grade trading was executed through portfolio trades (16% in July ’25).
Looking ahead, August issuance has averaged $97B over the past four years, but the post-Labor Day calendar is expected to be heavier than usual given the year-to-date pace and issuers’ desire to get ahead of potential rate hikes and the midterm elections.
Sources: AAM, JPM
Rating changes this month (rising stars/fallen angels at unsecured level per Bloomberg)
– Fallen angels: Harley-Davidson, Carnival Corp
– Rising stars: Chart Industries, Jane Street
Ticker Level Performance
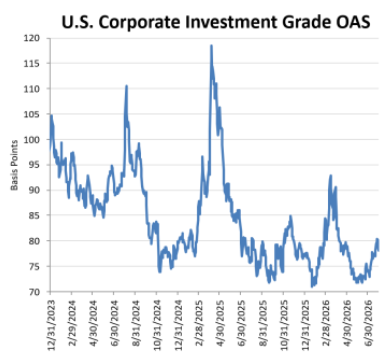
The following shows the top and bottom performing issuers based on ‘excess return per unit of duration’. This list excludes most with market values less than 0.05% of the Bloomberg Corporate Index as well as non-corporate issuers. AAM’s analysts have provided an explanation for issuer performance when relevant.
Corporate Market Graphs
(Source: Bloomberg, AAM)
Structured Products
By Chris Priebe and Mohammed Ahmed
Agency RMBS underperformed during July while CMBS remained resilient and ABS generated modest positive excess returns.
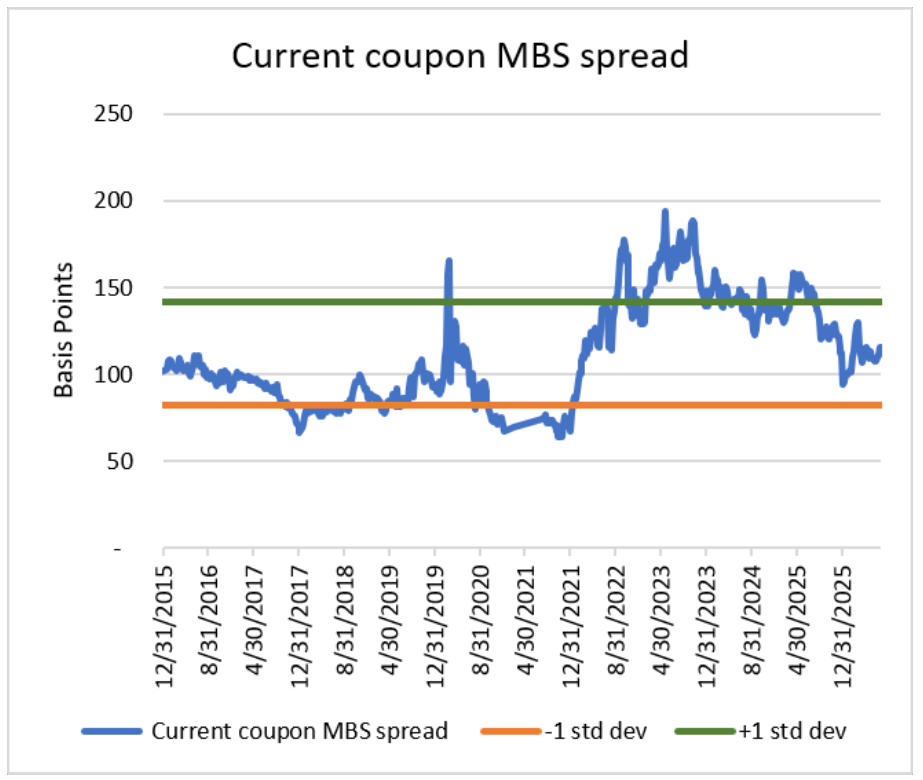
(Source for chart: Bloomberg – FNCL CC Spread to 5/10)
AGENCY RMBS ER -44 bps
Current coupon RMBS spreads generated their weakest excess returns of the year, widening approximately 7 bps during July. Current coupon spreads began the month near +107 bps and finished near +114 bps. Lower coupon mortgage securities underperformed while higher coupon securities performed comparatively better amid curve steepening and rate volatility. The Treasury 2s/10s curve steepened roughly 20 bps during the month, benefiting shorter-duration, higher-coupon sectors. Reduced demand from banks and money managers further weighed on performance. The rise in the 10-year has slowed refinance activity down, considerably lower than the peak in February when rates fell. The primary/secondary spread has been tightening since the start of the year.
CMBS ER -2 bps
CMBS spreads remained resilient despite broad macro volatility. July issuance slowed to approximately $13.8 billion, helping support secondary market valuations. Five-year spreads remained near 69 bps and ten-year spreads near 74 bps. Commercial real estate refinancing activity remained constructive, with more than 70% of maturing CMBS loans successfully refinancing, approximately in line with year-to-date experience.
ABS ER +5 bps
The ABS market experienced another heavy issuance month, with approximately $35.7 billion of new supply. Year-to-date issuance has increased materially relative to 2025. Autos and credit cards generated the strongest excess returns, while utilities lagged amid elevated new issuance. AAA CLO spreads were largely unchanged during the month despite higher forward rate assumptions, and handily outperformed fixed alternatives.
Municipal Bonds
By Greg Bell, CFA, CPA
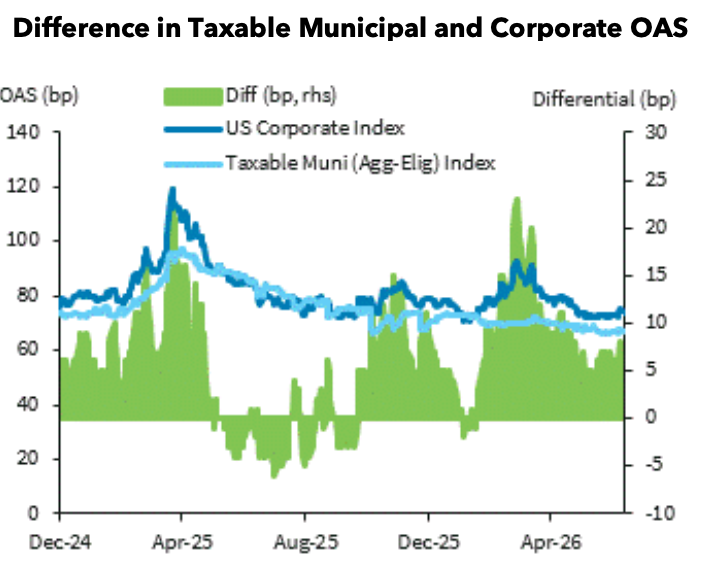
Tax-exempt municipals faced a more challenging environment in July, underperforming a weakening Treasury market despite highly supportive technical conditions. Taxable municipal spreads remained remarkably stable through the month, benefiting from limited issuance and the sector’s low-beta characteristics.
Taxables
Taxable municipal spreads remained largely unchanged during July despite rising Treasury yields and weakness in tax-exempt municipals. The AAA taxable curve closed the month at approximately 15, 20, 25, 43 and 48 basis points in the 3-, 5-, 7-, 10- and 30-year maturities, respectively, with most points on the curve finishing within 3 basis points of where they began the month. This stability highlights the sector’s historically low-beta behavior relative to broader fixed income markets.
Trading activity within higher education credits, which continue to represent a significant portion of investable AAA taxable municipal supply, showed remarkable stability throughout the month. Multiple institutional transactions in benchmark university issuers cleared within narrow spread ranges, demonstrating consistent two-sided liquidity despite broader market volatility.
One area of differentiation emerged in the seven-year sector among lower-rated issuers. Certain mid-AA credits widened meaningfully relative to AAA benchmarks, suggesting investors have begun demanding greater compensation for credit risk after months of compressed spread relationships. This trend has not yet expanded to other portions of the curve.
The primary support for taxable municipals remains limited supply. Year-to-date issuance stands at approximately $20.2 billion, down 6% from the prior year, while July issuance totaled only $1.1 billion, a 54% decline versus July 2025. The constrained supply environment should continue to limit broad spread widening, although recent developments suggest investors are beginning to differentiate issuers more heavily based on underlying credit quality.
(Source: AAM, Bloomberg) (Graph above: AAM, Bloomberg, Barclays)
Tax-exempts
Mutual fund flows moderated during July. The four-week moving average finished the month at $933 million versus $965 million in June, although the monthly average masked weakness late in the period. Long-term funds experienced net outflows during the final two weeks of July, while exchange-traded funds accounted for virtually all reported inflows in the final reporting week. Total July flows were approximately $5.4 billion.
Technical conditions remained exceptionally supportive. Reinvestment flows from coupons, calls and maturities totaled approximately $73 billion during July against only $43 billion of new issue supply, creating an estimated $30 billion net supply deficit, the most favorable monthly supply-demand imbalance of 2026. August is projected to deliver approximately $77 billion of reinvestment demand against roughly $56 billion of issuance, providing continued technical support, although softening fund flows warrant monitoring.
Despite favorable technicals, performance lagged Treasuries during July. Ten-year Treasury yields increased 27 basis points while ten-year tax-exempt yields rose 42 basis points. The resulting underperformance caused relative valuations to cheapen, with the 10-year muni-to-Treasury ratio increasing to 71.2% from 66.1% at the end of June. That level now sits essentially in line with its five-year average of 71.0%, marking the first time this year that the intermediateportion of the curve has traded near fair value on that measure. The ICE BofA U.S. Municipal Securities Index declined 1.41% during July.
Municipal issuance remains elevated on a year-to-date basis, running 4% ahead of last year’s pace at $345.5 billion through July 29. However, July issuance came in approximately $7 billion below forecasts and 11% below prior-year levels. Importantly, new-money financing remains down year-over-year, while refunding activity has accounted for the increase in total issuance.
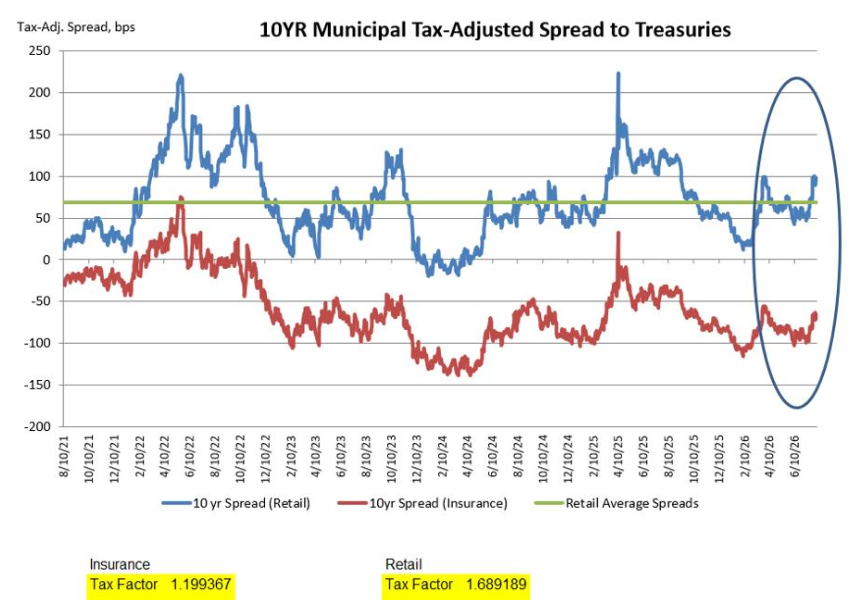
On a tax-adjusted basis, spreads to Treasuries widened across the curve during July, with the 10-year tax-adjusted spread ending the month at -69 basis points, its cheapest level of the year. While July’s cheapening improved relative value, taxable alternatives continue to offer a yield advantage over tax-exempt municipals across nearly the entire curve for institutional investors subject to the 21% corporate tax rate.
(Source: AAM, Bloomberg, Refinitiv)
U.S. Equity Performance – July


Budgeting Losses Can Buy Wins: “Moneyball” for Insurance Investing
September 21, 2026