Fixed Income Summary
By Elizabeth Henderson, CFA
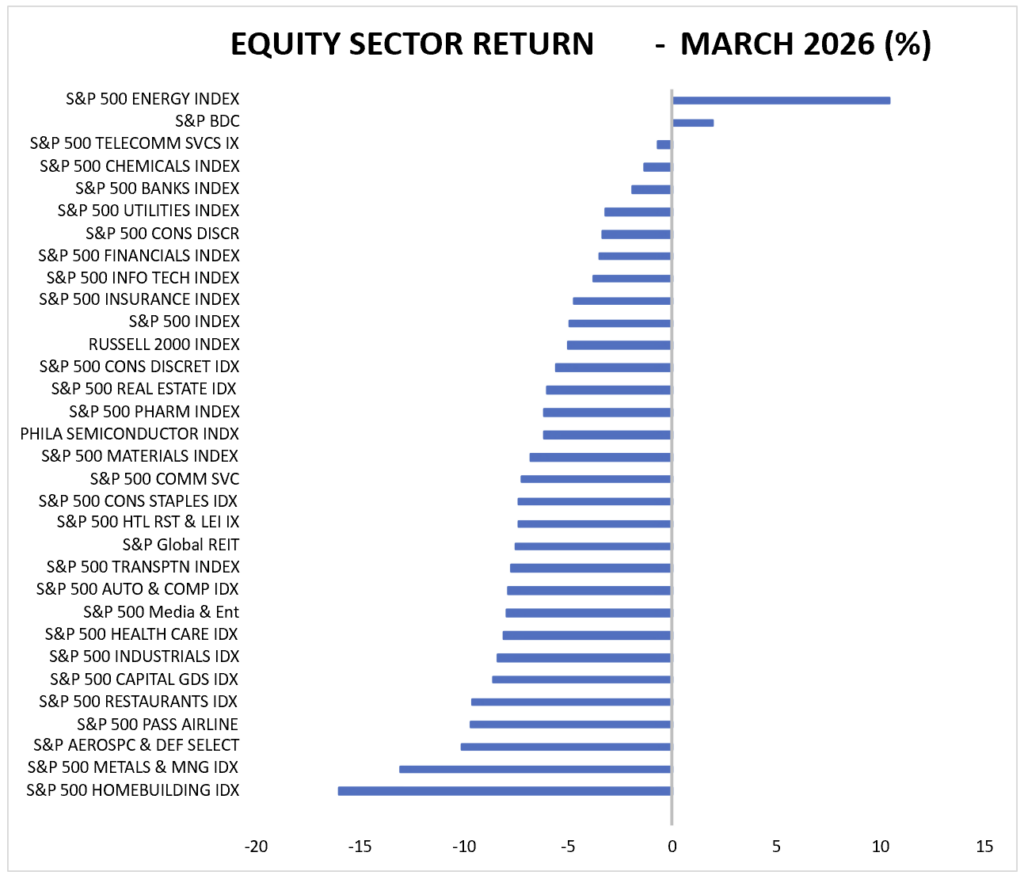
March delivered a more volatile backdrop for investment-grade fixed income, with heightened geopolitical tensions involving Iran adding to commodity- and inflation-sensitive pressures that pushed yields higher and increased rates volatility. Returns were driven primarily by moves in interest rates and volatility rather than a broad deterioration in fundamentals. Spread widening was concentrated in M&A‑related issuers, while economic and idiosyncratic risks weighed on Autos, Banks, and BDCs. Energy and Chemicals outperformed, supported by firmer commodity prices and elevated geopolitical risk. In securitized markets, performance was mixed: Agency RMBS lagged as rate volatility drove spreads wider, while CMBS and ABS were comparatively resilient despite active issuance. Municipal bonds also generated negative excess returns in March, with tax-exempts underperforming due to weaker technicals.
IG Fixed Income Recap
Corporate Market
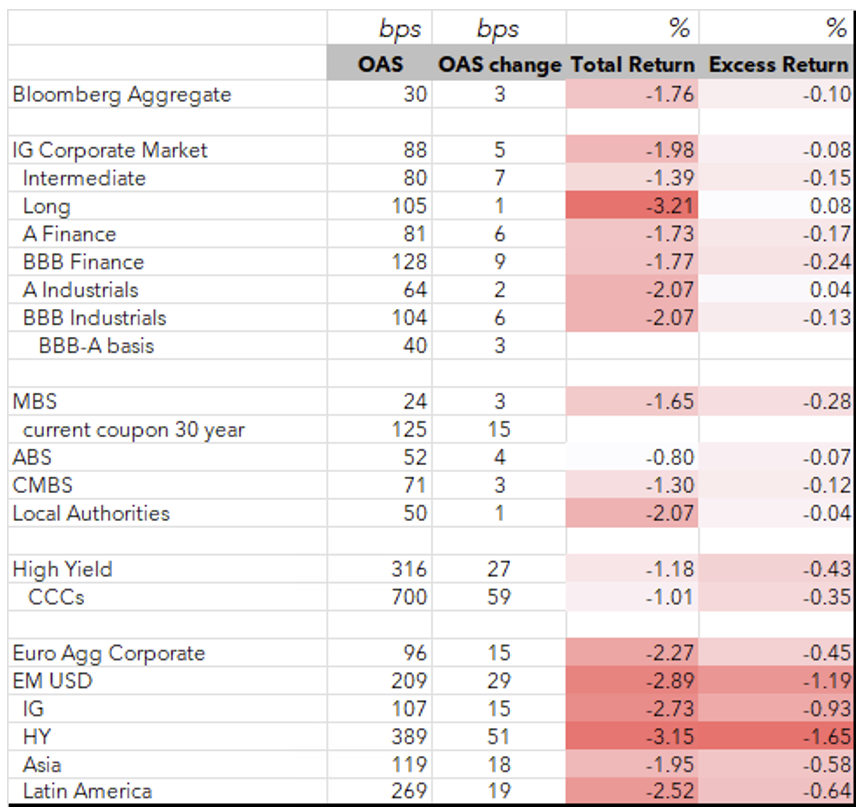
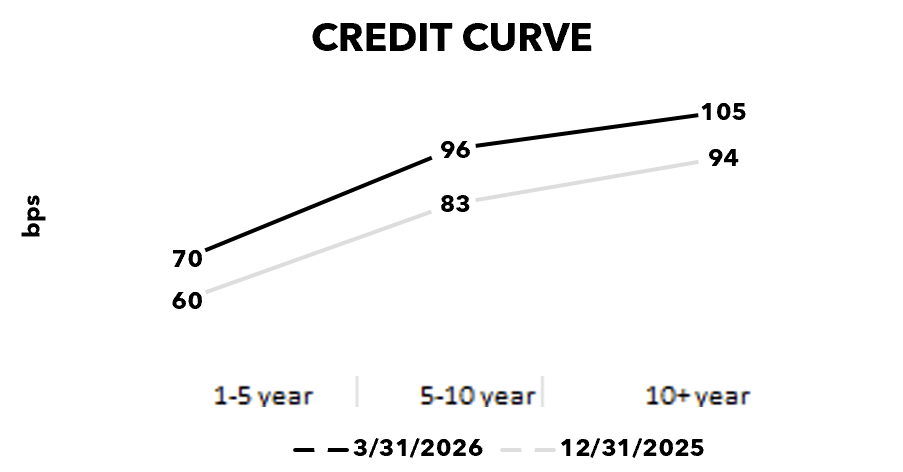
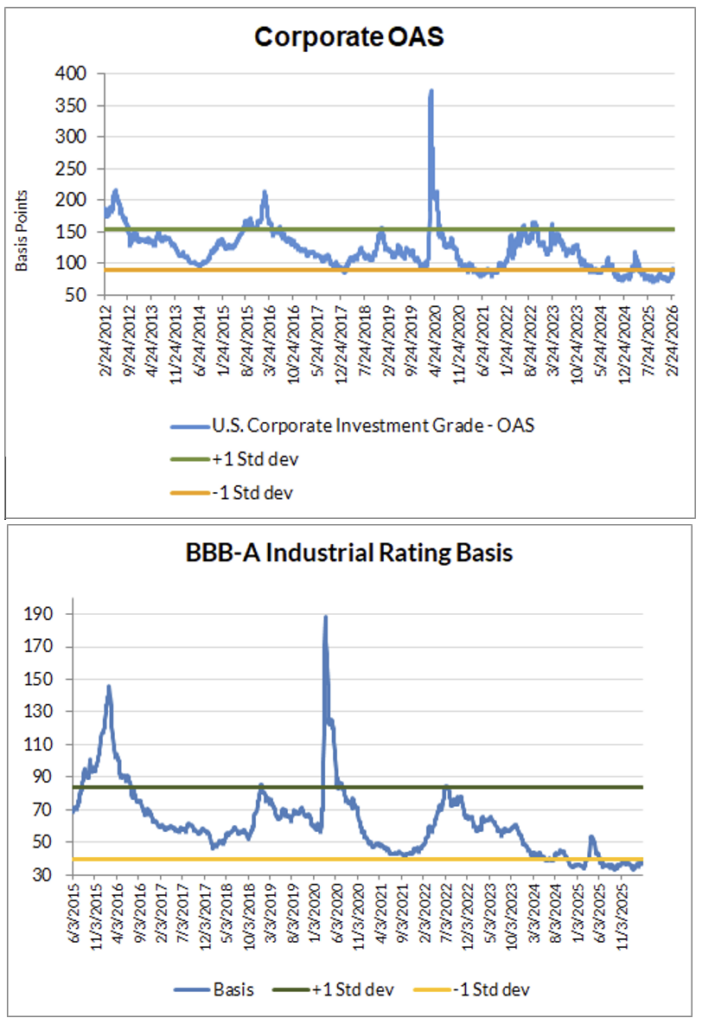
Corporate spreads widened further in March, extending the reset in excess returns, driven primarily by higher Treasury yields and elevated volatility rather than a broad deterioration in credit fundamentals. New issue supply remained heavy, while risk repricing was more rate-led than sector-specific. Unlike February, spread widening was more uniform across quality and capital structure, with limited differentiation between BBBs and As or between senior and subordinated financials. The credit curve flattened as long-end rates rose and demand from yield buyers was strong. Spread widening was concentrated in M&A‑related issuers, while economic and idiosyncratic risks weighed on Autos, Banks, and BDCs among others. In contrast, Energy and Chemical issuers outperformed on improving fundamentals tied to higher commodity prices amid the Iran conflict.
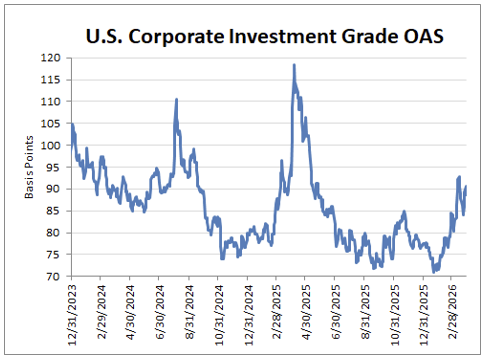
Despite the month’s weakness, corporate OAS remains rich to history, still inside long‑term averages and leaving valuations vulnerable to continued rate volatility.
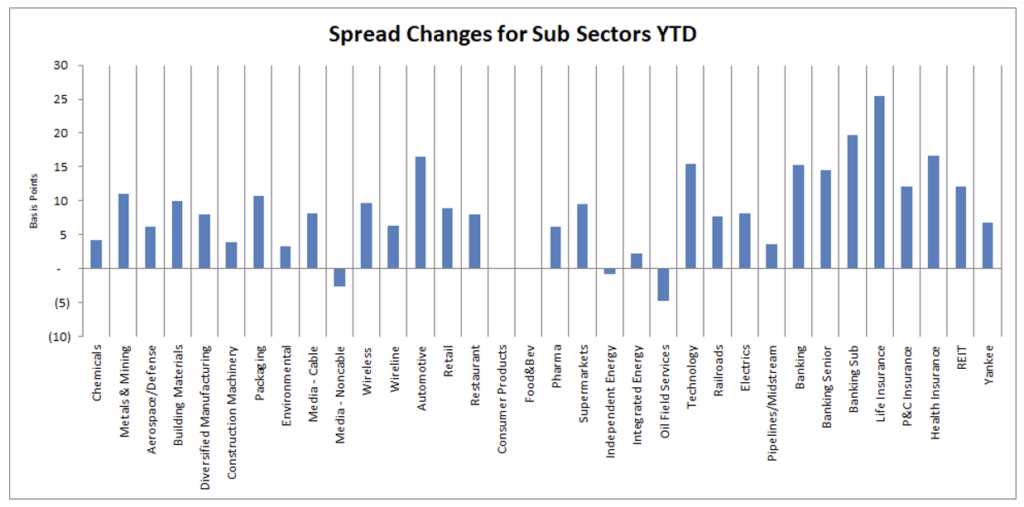
Looking at sectors relative to Industrials (Sector OAS/Industrial OAS):
- • Z scores >1.5: Cable, Food & Beverage, Technology, Health Insurance, Finance Companies, Life Insurance, Banking (senior), Chemicals, P&C Insurance
- • Z scores <-1.5: Metals & Mining, Environmental, Independent Energy, Midstream, Integrated Energy, Oil Field Services, Pharma, Media, Diversified Manufacturing, Building Materials, Aerospace & Defense, Wireless,
Source: Bloomberg, AAM (bold=new for the month; strike-through = no longer valid vs last month; 5+years unless noted for last twelve months)
Corporate Market Technicals and Rating Changes
High‑grade fund flows remained supportive in March, though trading conditions became more volatile. Secondary trading volumes stayed elevated versus last year, but rate volatility led to wider bid‑ask spreads at times.
New‑issue supply stepped up meaningfully in March, with issuance accelerating versus February as issuers took advantage of still‑open windows, reinforcing expectations for approximately $240 billion of supply for the month and roughly $1.8 trillion for full‑year 2026.
Coupon and maturity income increased in March, providing an important offset to spread volatility.
Sources: AAM, BAC, JPM
Rating changes this month (rising stars/fallen angels at unsecured level per Bloomberg)
- – Fallen angels: Transcontinental Inc, FS KKR Capital (BDC), Paramount
- – Rising stars: Western Digital, Seagate, Vistra, Big River Steel, Aspen Insurance, Permian Resources, SPX Flow
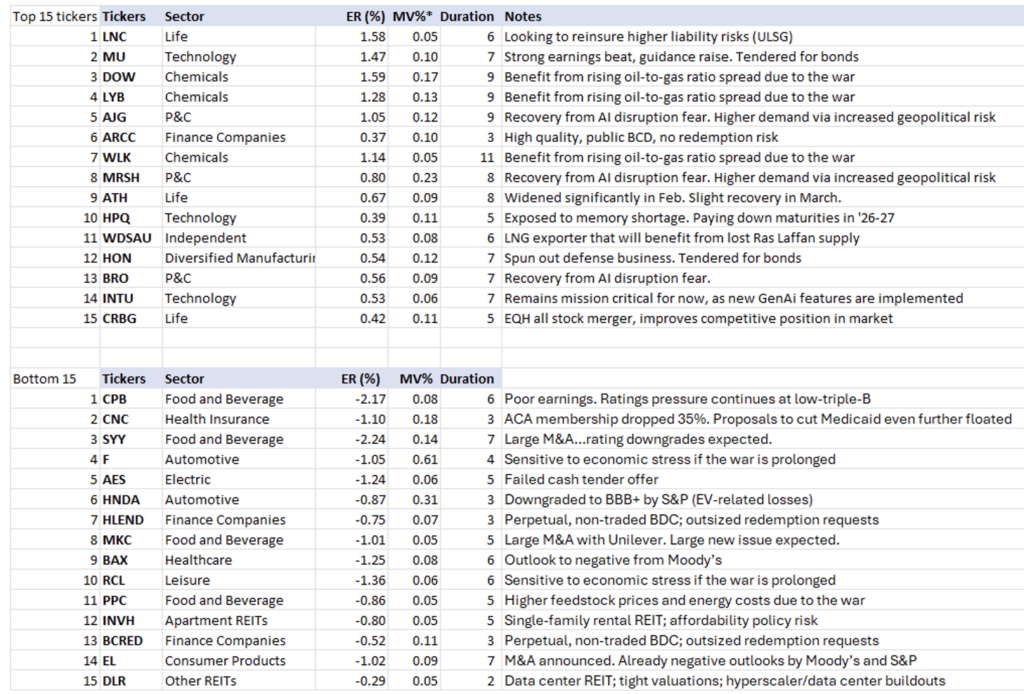
Ticker Level Performance
The following shows the top and bottom performing issuers based on ‘excess return per unit of duration’. This list excludes those with market values less than 0.05% of the Bloomberg Corporate Index as well as non-corporate issuers. AAM’s analysts have provided an explanation for issuer performance when relevant.
Corporate Market Graphs
(Source: Bloomberg, AAM)
Structured Products
By Chris Priebe and Mohammed Ahmed
March performance was pressured by volatility‑driven spread widening in RMBS and CMBS, partially offset by smaller losses in ABS
AGENCY RMBS ER -28 bps
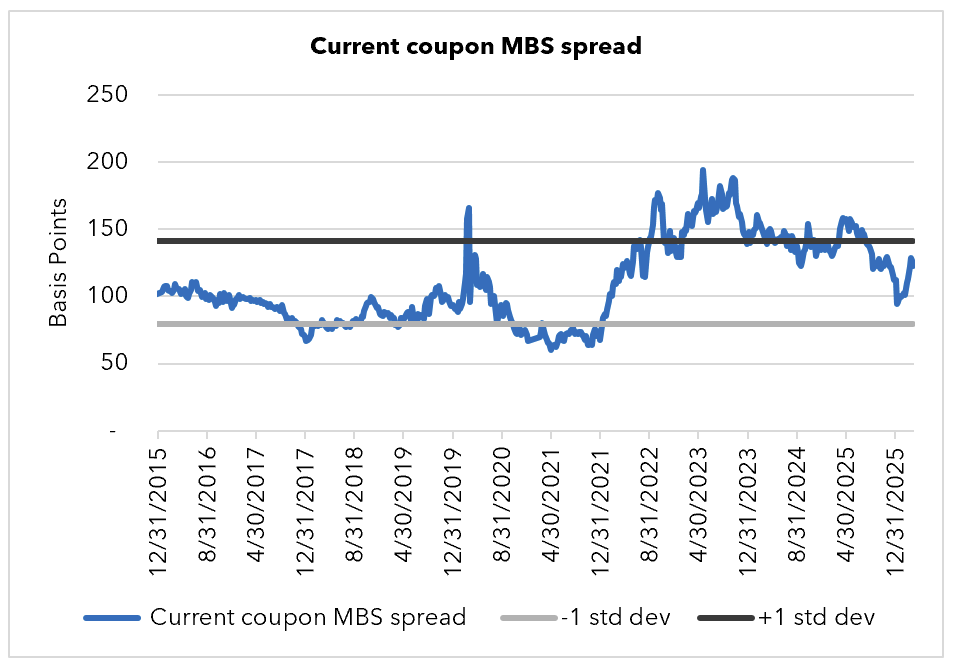
RMBS spreads widened in March primarily due to higher rate volatility and macro uncertainty, not deteriorating fundamentals. As rates backed up and volatility increased, investors demanded additional compensation for convexity and liquidity risk, particularly given limited marginal demand from banks and the Fed. The MOVE volatility index nearly doubled over the month, rising from the mid‑60s in February to above 110 by late March. Agency RMBS spreads widened by roughly the high‑teens on the month, with OAS ending near +125. Mid‑dollar discount coupons, particularly 30‑year 3.50s through 5.00s, were the weakest performers, while higher‑coupon 30‑year 7.00s outperformed (approximately +36 bps) as prepayment risk diminished. Despite the Fed‑directed GSE buying announcement, real‑money participation remained limited, with banks, money managers, hedge funds, and REITs largely sidelined. (Source for chart: Bloomberg – FNCL CC Spread to 5/10)
CMBS ER -12 bps
CMBS performance softened modestly in March amid higher Treasury rates and a more volatile macro backdrop. Total CMBS issuance was approximately $13.5 billion, with higher rates contributing to more subdued supply relative to February, particularly within the Single Asset / Single Borrower (SASB) segment. New‑issue spreads widened by roughly 6 bps over the month in sympathy with broader spread products, ending March around 88 bps. Despite the wider market tone, demand remained selective rather than absent, with investors showing strong interest in well‑structured, front‑cashflow conduit and SASB transactions—particularly where extension protection and amortization enhanced downside resilience. Scarcity of longer‑dated CMBS, especially in the 10‑year sector, helped support execution in higher‑quality deals even as overall issuance slowed.
ABS ER -7 bps
ABS performance softened modestly in March amid heightened rate volatility, despite a constructive underlying tone. Total ABS issuance was approximately $34 billion for the month, including an unusually heavy $7.5 billion of data center supply. Performance across major ABS subsectors was mixed, with Cards, Autos, and Utilities delivering excess returns of roughly ‑3 bps, ‑7 bps, and ‑30 bps, respectively. CLO AAA spreads were effectively unchanged for the month, holding near 118, though weakness persisted further down the capital structure as underlying leveraged loan prices continued to decline. Elevated volatility weighed on lower‑quality credit, with loan prices down approximately another point year‑to‑date. The new‑issue market remained active, with AAA coupon deals resetting lower versus levels seen two years ago, reflecting higher base rates rather than a deterioration in credit fundamentals.
Municipal Bonds
By Greg Bell, CFA, CPA
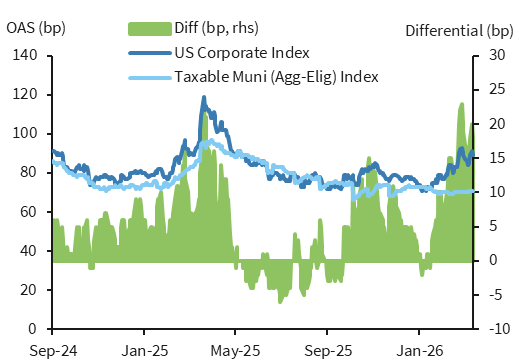
Tax-exempts underperformed amid elevated market volatility and deteriorating demand, which pressured relative valuations. Taxable municipal spreads widened modestly, consistent with broader weakness across other taxable fixed-income sectors.
Taxables
Taxable municipal issuance remains a supportive mechanism for spreads to remain tight across the sector, as the persistently low new issuance environment continues to reinforce favorable technical conditions. Despite this backdrop, spreads moved modestly wider during March, with spreads in 3, 5, 10 and 30-year maturities widening by 5, 4, 6 and 7bps, respectively. (Source: Bloomberg, AAM). Overall spread levels remain tight by historical standards, reflecting the continued imbalance between limited supply and steady institutional demand, coupled with a stable underlying credit environment. Demand remains particularly strong in maturities seven years and shorter, where spreads continue to exhibit consistent support. In contrast, the longer end of the curve has experienced more pronounced movement, with widening trends more closely aligned with broader weakness across other taxable fixed income sectors.
Looking ahead, the market expects a continuation of the muted new issuance cycle, which should provide ongoing support for spread levels across the curve. However, broader rate volatility remains a key risk factor, particularly in the context of geopolitical uncertainty stemming from the Iran war effort, which has contributed to increased market volatility and may continue to influence spread behavior in the near term. (Source: Bloomberg, AAM)
Tax-exempts
Technical conditions for the tax-exempt sector weakened materially during March, as a combination of elevated market volatility surrounding the Iran war and a deterioration in seasonal supply-demand dynamics pressured relative valuations. The shift was driven by heavier new issue supply, a meaningful decline in reinvestment flows, and weakening mutual fund demand, all of which contributed to the softest relative value levels observed since September 2025.
Reinvestment flows declined sharply to approximately $41B during the month, representing a 35% decrease from February levels. At the same time, new issue supply increased to approximately $53B. Although issuance came in modestly below expectations, the broader technical backdrop remained challenged due to rising interest rates and weakening demand conditions. Mutual fund flows also deteriorated, as the rise in 10-year Treasury yields of over 40bps during the month pressured the first meaningful outflows following a 17-week streak of inflows. Outflows reached $599M during the third week of March, while the four-week average declined by 47% to $815M from February levels. (Source: Bond Buyer, Lipper, Bloomberg, BofA)
Rates responded accordingly, with tax-exempt yields moving significantly higher across the curve. In 10-year maturities, yields increased by approximately 60bps during the month, underperforming Treasuries, which rose by 38bps over the same period. This underperformance drove a meaningful repricing in relative value metrics, with 10-year muni-to-Treasury ratios reaching a 2026 high of 72.68% on March 26th, the highest level since September 10, 2025, when ratios reached 72.90%. The ratio ended the month at 72.24%, reflecting a substantial cheapening in tax-exempt valuations. (Source: Bloomberg, Refinitiv)
From a relative value perspective, tax-adjusted yield spreads to Treasuries widened materially, ending the month at -58bps, representing a 34bps increase from February levels. While spreads have become less extreme, taxable alternatives continue to offer a meaningful yield advantage for institutional investors, limiting crossover demand for tax-exempt securities at current levels.
Looking ahead, the technical backdrop is expected to remain a headwind for the sector. New issuance is projected to remain elevated at approximately $57B in April, while reinvestment flows are expected to remain subdued. In addition, potential mutual fund outflows ahead of the April 15th tax-filing deadline could further pressure demand conditions. As a result, the combination of heavy supply, reduced reinvestment support, and ongoing rate volatility may continue to weigh on tax-exempt yields and relative valuation levels in the near term. (Source: Bond Buyer, Lipper, Bloomberg)
U.S. Equity Performance


Middle East Ceasefire: What Has Changed for Energy Fundamentals and What Hasn’t
April 8, 2026