
Fixed Income Summary
By Elizabeth Henderson, CFA
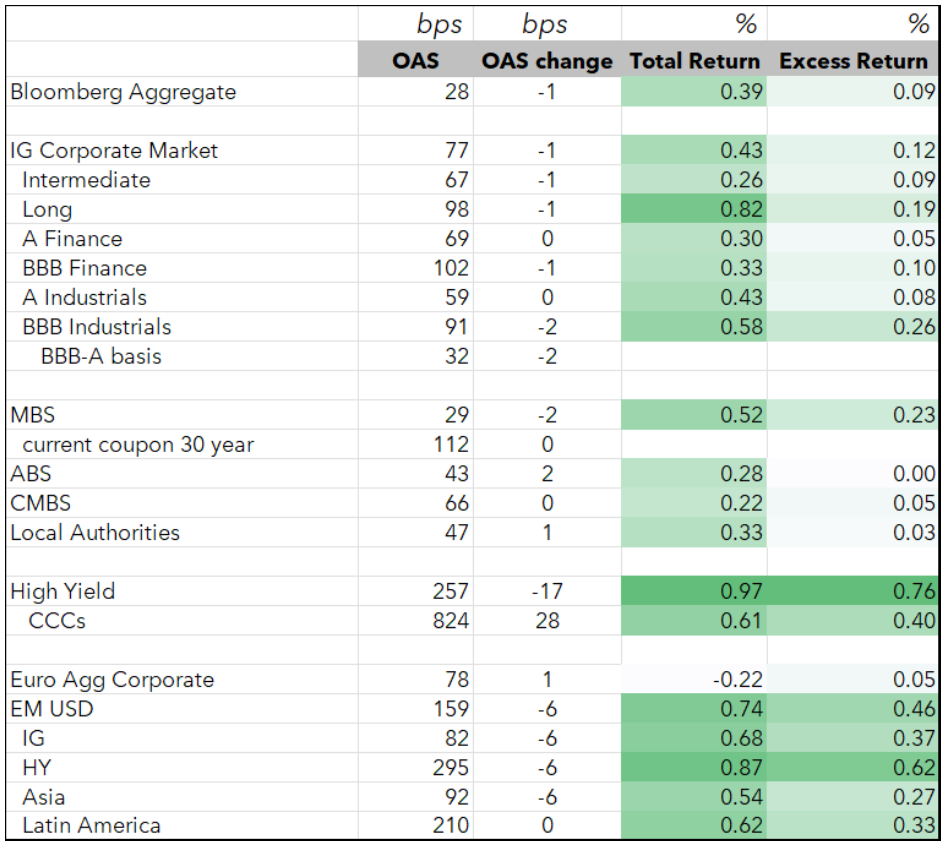
Investment grade fixed income markets faced another challenging month as a global bond sell-off reflected concerns around heavy government borrowing, persistent inflation risk, higher energy prices, and the possibility that central banks may need to keep policy tighter for longer. Credit spreads generally remained resilient relative to the magnitude of rate moves. Structured products held up well, with agency RMBS generating positive excess returns, CMBS modestly positive, and ABS broadly flat as lighter seasonal activity met steady demand. Municipal performance was more bifurcated: taxable muni spreads were stable on limited supply, while tax-exempts bear-steepened as long-end valuations cheapened and reinvestment support began to fade.
IG Fixed Income Recap
Corporate Market
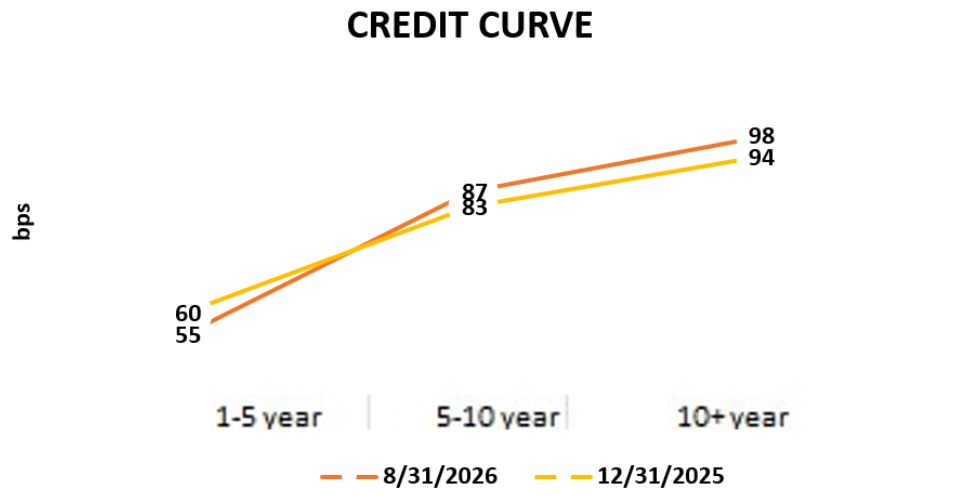
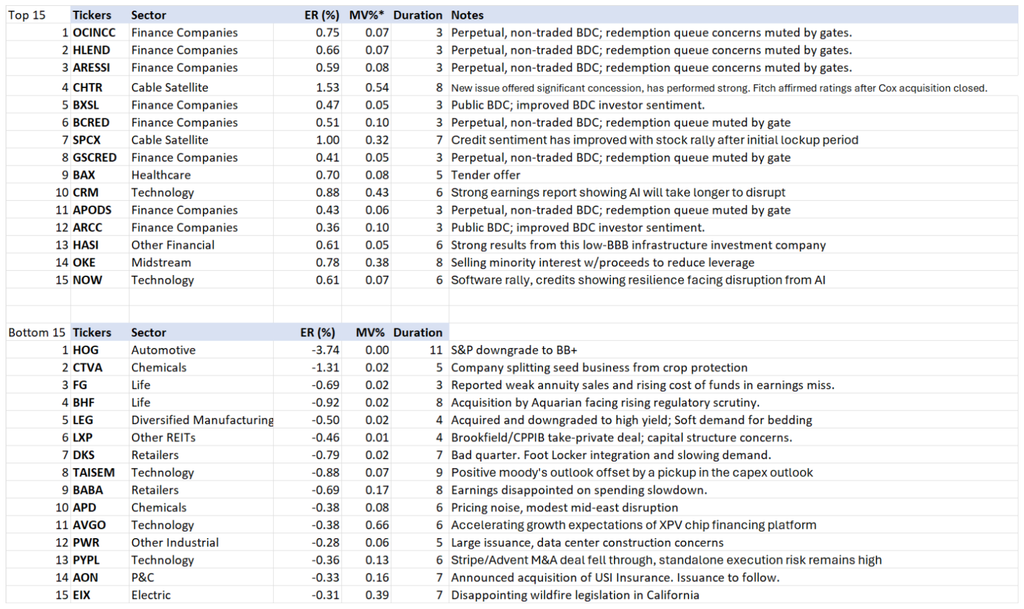
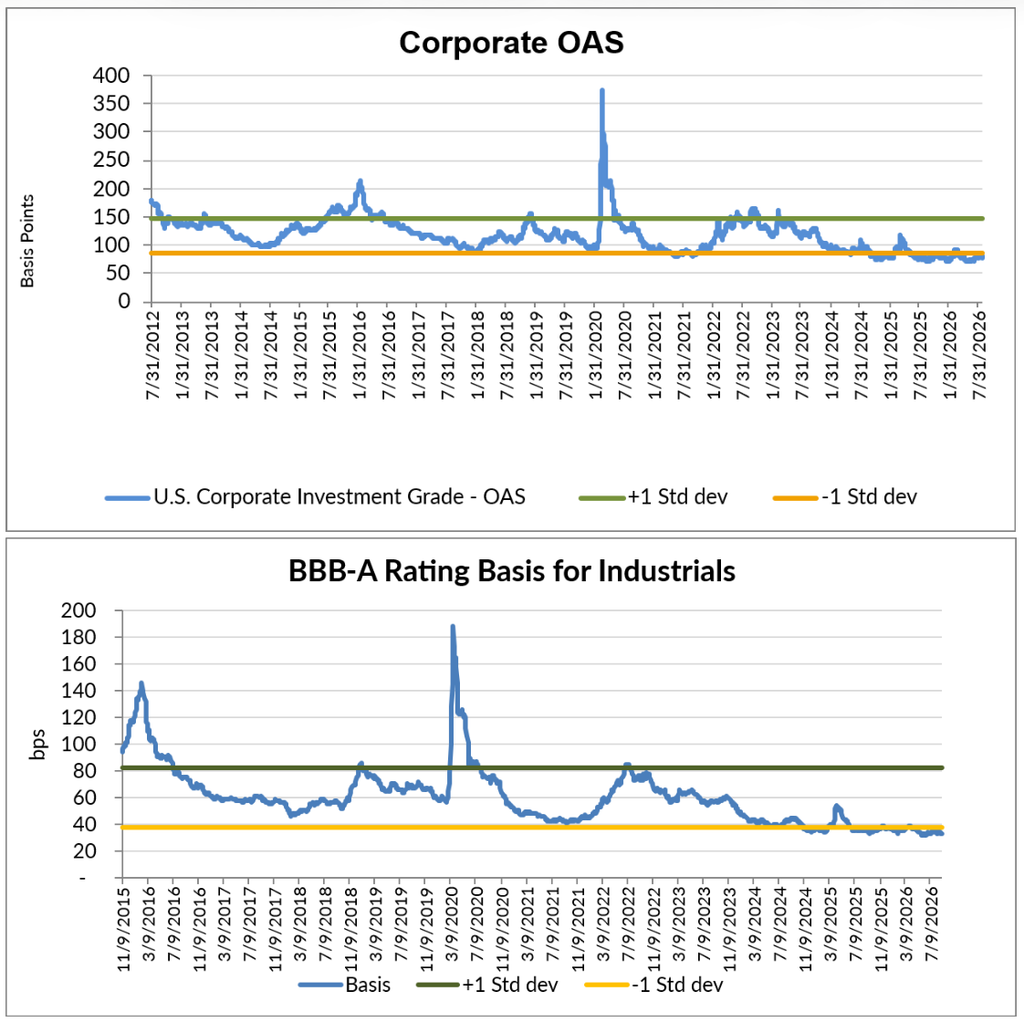
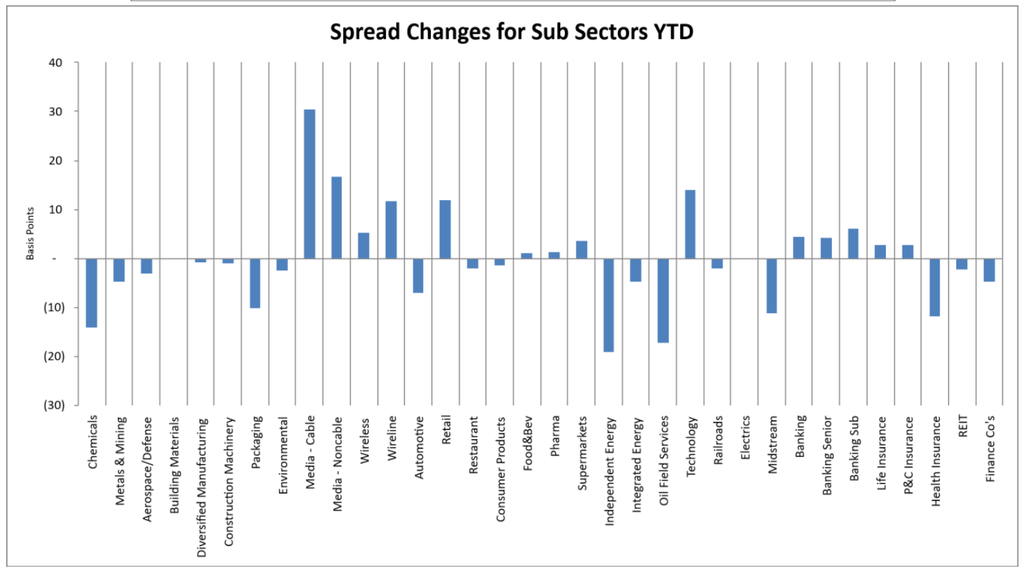
Corporate credit fundamentals remained stable in August, with investment-grade issuers continuing to benefit from solid balance sheets, manageable leverage, and healthy access to capital. Rating migration was constructive, with fallen angels related to M&A as opposed to fundamental deterioration and several rising stars. Valuations remained firm, as spreads stayed near the tighter end of recent ranges despite higher Treasury yields and continued investor focus on areas affected by heavy capital spending. Sector dispersion created more of the opportunity set: Technology, Media, Wireline, Retail, and Cable screened wider relative to Industrials, while several cyclical and defensive sectors screened tighter. Overall, the market remained fundamentally sound, but valuation discipline remained important given tight aggregate spreads and uneven sector performance.
Looking at sectors relative to Industrials (Sector OAS/Industrial OAS):
• Z scores >1.5: Cable, Technology, Life Insurance, Media, Wireline, Retail
• Z scores <-1.5: Metals & Mining, Environmental, Independent Energy, Midstream, Aerospace & Defense, Restaurant, Pharma, Packaging, Chemicals, Diversified Manufacturing, Oil Field Services
Source: Bloomberg, AAM (bold=new for the month; strike-through = no longer valid vs last month; 5+years unless noted for last twelve months)
Corporate Market Technicals and Rating Changes
August high-grade corporate issuance reached a record $163B, 68% above the average August pace, while year-to-date supply rose to $1.496T, up 37% year-over-year. Despite heavy supply, spreads tightened modestly, reinforcing that issuance is not inherently negative when demand remains strong. New issues outperformed the market.
Net issuance was also elevated at $91B, driven partly by hyperscaler and data-center supply. Higher all-in yields and renewed fund inflows supported positive total returns, with high-grade public mutual funds and ETFs taking in $28.7B during the month.
For the full month of August, average daily trading volume for high-grade was $40.1B, down 12% vs. July and the lowest monthly average year-to-date, but still above last August.
Sources: AAM, J.P. Morgan Daily Credit Strategy Update, 9/1/2026
Rating changes this month (rising stars/fallen angels at unsecured level per Bloomberg)
– Fallen angels: Cox Communications, Electronic Arts, Leggett & Platt
– Rising stars: Roblox, Teva, Beacon Financial, Seagate
Ticker Level Performance
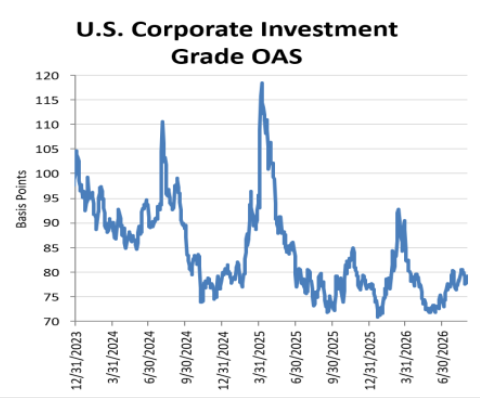
The following shows the top and bottom performing issuers based on ‘excess return per unit of duration’. This list excludes most with market values less than 0.05% of the Bloomberg Corporate Index as well as non-corporate issuers. AAM’s analysts have provided an explanation for issuer performance when relevant.
Corporate Market Graphs
(Source: Bloomberg, AAM)
Structured Products
By Chris Priebe and Mohammed Ahmed
Agency RMBS posted healthy excess returns, CMBS was modestly positive, and ABS was flat in August amid lighter seasonal activity and steady structured product demand.
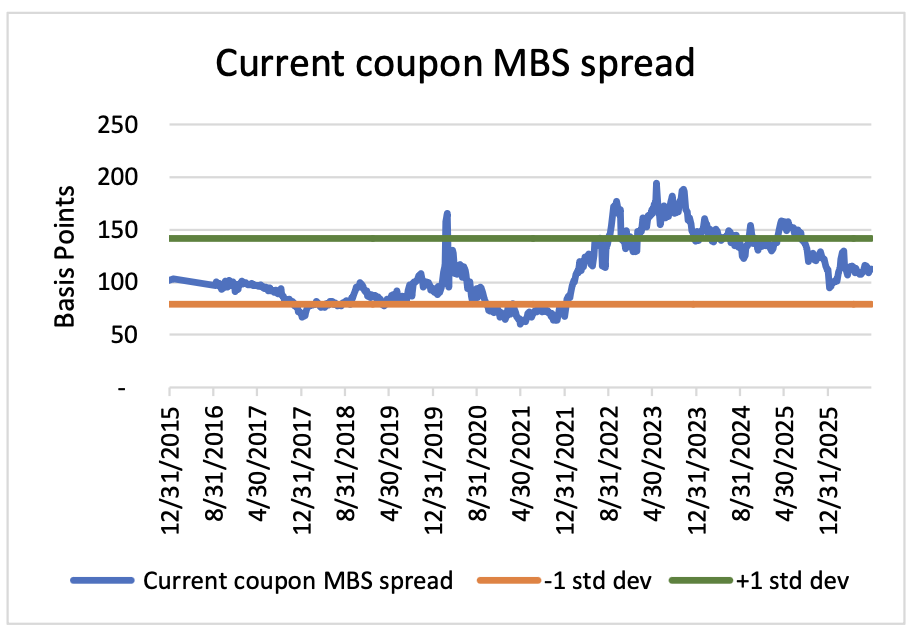
(Source for chart: Bloomberg – FNCL CC Spread to 5/10)
AGENCY RMBS ER +23 bps
Agency RMBS generated healthy excess returns of 23 basis points in August, supported by 4 basis points of spread tightening as current coupon spreads moved from approximately +114 to +110. Performance was weakest in 30-year 6.50s and 7.00s, which produced +15 and -3 basis points of excess return, respectively. In contrast, 30-year 3.50s and 4.00s reversed July’s weakness and were among the strongest performers, generating +41 and +35 basis points of excess return, respectively. Non-agency current coupon pass-throughs performed broadly in line with agency MBS, trading 1–2 points back in July before tightening to 28 ticks back by month-end. Fed Chair Warsh’s Jackson Hole remarks reinforced the Fed’s inflation-fighting stance and increased expectations for a September rate hike. The 2s10s Treasury curve round-tripped from +41 basis points to +55 basis points and back to +41 basis points, helping lower coupons outperform modestly as the 2-year Treasury remained more volatile. Money managers added selectively on weaker days, while banks and hedge funds remained largely inactive. Seasonal summer slowdowns and vacation schedules also contributed to lighter market activity in August.
CMBS ER +5 bps
CMBS issuance totaled $14.5 billion in August, with Single Asset/Single Borrower transactions accounting for 75% of volume and conduit transactions representing the remaining 25%. Investors pushed back on loan overlap across multiple conduit deals, resulting in an average new-issue concession of 6 basis points. Curve flattening supported intermediate and longer-duration CMBS during the month, while floating-rate issuance also performed well. Within the Single Asset/Single Borrower segment, transactions backed by New York office properties continued to be the strongest performers in August.
ABS ER 0 bps
ABS supply followed its typical lighter August pattern, with $30.1 billion of new issuance during the month and only $2.5 billion pricing in the final week. The sector generated 0 basis points of excess return in August. Credit cards and autos produced -1 and +1 basis points, respectively, while utilities were unchanged. Esoteric ABS spreads were also broadly stable. CLO spreads tightened by 2 basis points, moving from +120 to +118 amid steady new-issue and reset activity. CLOs once again outperformed their fixed-rate alternative, supported by stable demand and continued resilience in the floating-rate structure. Pricing on underlying software loans, especially shorter-dated loans, improved by approximately one point to an average price of $92.
Municipal Bonds
By Greg Bell, CFA, CPA
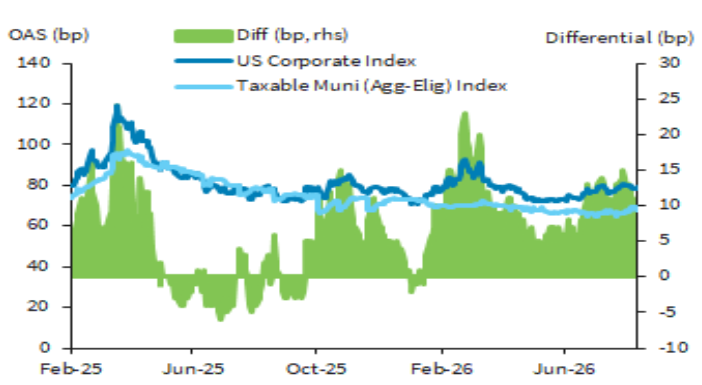
Taxable muni spreads were little changed in August, supported by limited supply, while tax-exempts bear-steepened. Front-end ratios richened, but longer maturities cheapened, creating better relative value out the curve. With reinvestment flows set to decline, technical pressure is most likely toshow up at the long end.
Taxables
Taxable municipal spreads to Treasuries were effectively unchanged over the month, moving within a three basis point band across the curve, with ten-year spreads flat at 41bps and thirty-year spreads wider by 1bp at 49bps. In a month in which the tax-exempt long end cheapened 9 to 17bps in yield and the municipal curve steepened materially, the taxable sector did not participate in the repricing at all. (Source: AAM, Bloomberg)
Supply scarcity remains the mechanism behind that stability. Taxable issuance totaled $3.27B across 69 issues in August, and while that represents a 39.0% increase over an unusually light prior-year base, the sector remained roughly 5.5% of the month’s long-term volume. The calendar has not rebuilt to a level that would require the market to clear meaningful new-issue concessions, and in a month in which the tax-exempt secondary was visibly congested by unsold new-issue paper, the absence of a comparable taxable calendar is what insulated the sector from that pressure. (Source: Bond Buyer, LSEG, AAM)
We continue to view the ten- to thirty-year portion of the taxable curve as fairly valued, and the combination of a muted new-issue profile and a stable underlying credit environment should keep spreads rangebound near current levels. The principal risk to that view is rate volatility transmitted from outside the municipal market rather than anything originating within it, and the long end remains the tenor most exposed on that count.(Source: AAM, Bloomberg)
Tax-exempts
August was a curve month rather than a directional one. AAA yields declined 7 to 10bps inside of five years and were unchanged in ten years, while fifteen-, twenty- and thirty-year maturities rose 17, 13 and 9bps. Treasuries moved in the opposite direction, bull-flattening modestly with the two-year higher by 5bps and the thirty-year lower by 3bps. Muni-to-Treasury ratios consequently richened sharply up front and cheapened past fifteen years: the two-year ratio fell to 58% from 61% against a five-year average near 63%, the ten-year was essentially unchanged at 71% and sits on its historical average, and the thirty-year rose to 88% from 86%. The steepening was municipal in origin rather than macro, with the 2-30yr municipal slope widening 19bps to 207bps and the muni-to-Treasury slope differential widening 27bps over the same period. (Source: Refinitiv MMD, Bloomberg, AAM)
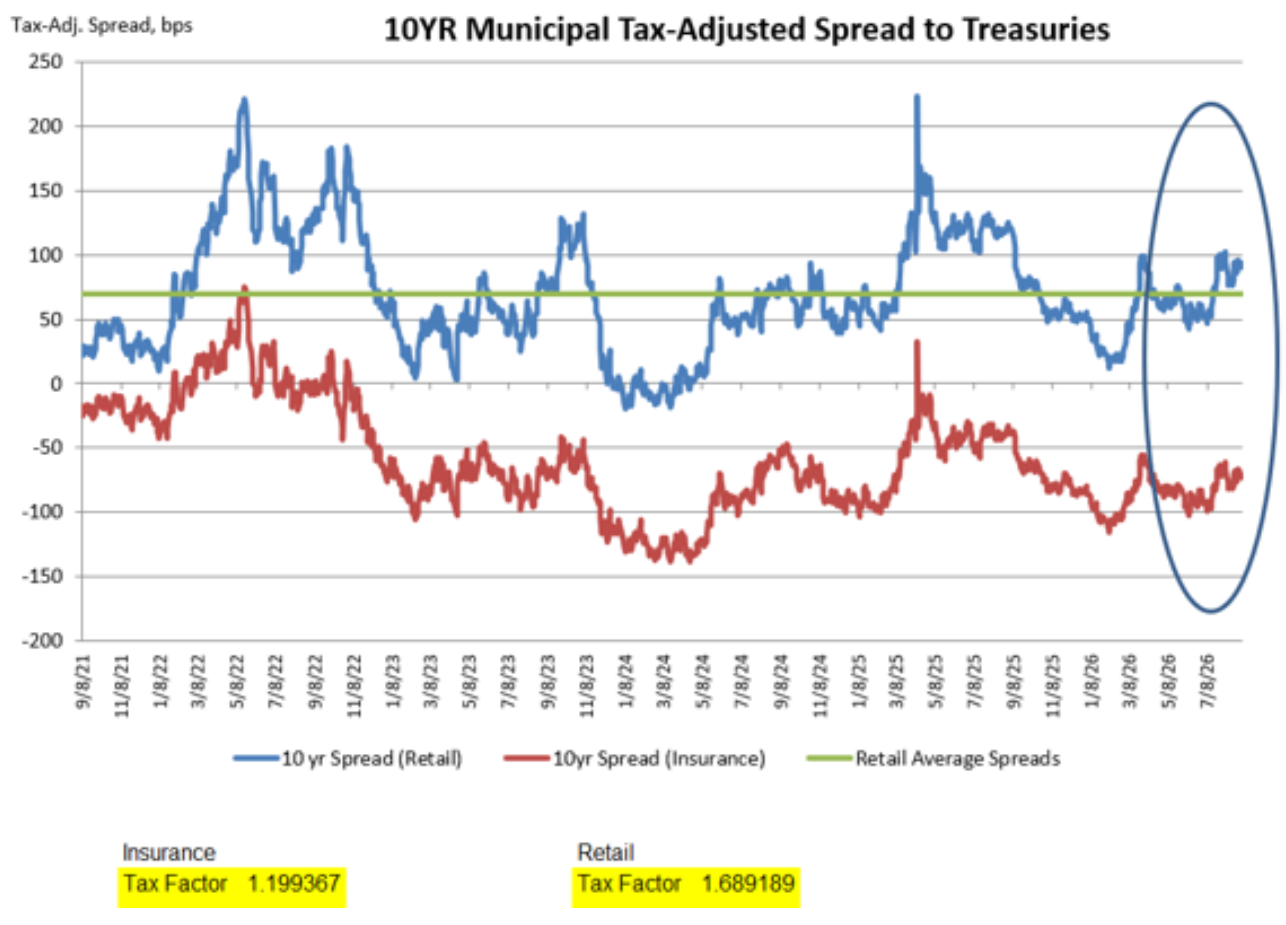
On a tax-adjusted basis, applying the standard gross-up for the 21% corporate rate, relative value migrated decisively out the curve. Spreads to Treasuries richened by 17, 13 and 13bps in two-, three- and five-year maturities and by 2bps in ten years, while cheapening 22, 20 and 14bps in fifteen, twenty and thirty years. The practical effect is that the front end has become expensive relative to its own history, while the long end has recovered a valuation case that has been absent for most of the year. Fifteen-year paper ended the month at -24bps against a five-year average of -32bps, and the thirty-year at +27bps is the only point on the curve offering a positive nominal tax-adjusted pickup to Treasuries. (Source: AAM, Bloomberg, Refinitiv)
Technicals were two-sided. Weekly reporting funds took in approximately $4.38B over the four reporting weeks of August, lifting the four-week moving average to $1,095mn from $933mn at the end of July, an increase of 17.4% and roughly 1.11 times the rolling one-year average. Composition improved as well, with long-term funds accounting for $2.64B of the month’s total and $878mn of the final week’s $1.44B intake, a marked change from July when the long end was supported principally by passive flow. Offsetting that, long-term issuance was reported at $59.57B across 873 issues, up 14.5% year-over-year, with the tax-exempt component at $51.98B, up 11.4%, bringing year-to-date volume to approximately $399.8B and running roughly 4% ahead of last year. The year-over-year gain was concentrated in smaller local credits, and new issues that had come with concession late in the month were still not finding traction inthe secondary, trading at elevated spreads and pulling the balance of the market wider. (Source: Lipper, Bond Buyer, LSEG, Refinitiv MMD)
Looking ahead, the reinvestment cushion that supported the market through August is set to shrink materially. August carried the heaviest reinvestment of the year at approximately $85B of coupons, calls and maturities, which against the month’s issuance produced net negative supply of roughly $26B — and the long end still conceded 9 to 17bps. September reinvestment is projected at approximately $55B, a decline of $30B that leaves net supply essentially flat, and October reinvestment falls further to approximately $47B against a heavier calendar, turning net supply positive by roughly $15B for the first time since the spring. Fund flows have improved in both size and composition, but they are a fraction of the reinvestment channel and cannot offset a swing of that magnitude. With the front end already richened to levels that leave little room for further gain, the pressure is most likely to be expressed past fifteen years.(Source: AAM, BofA, Bond Buyer, Refinitiv MMD)
U.S. Equity Performance – August


Budgeting Losses Can Buy Wins: “Moneyball” for Insurance Investing
September 21, 2026