Fixed Income Summary
By Elizabeth Henderson, CFA
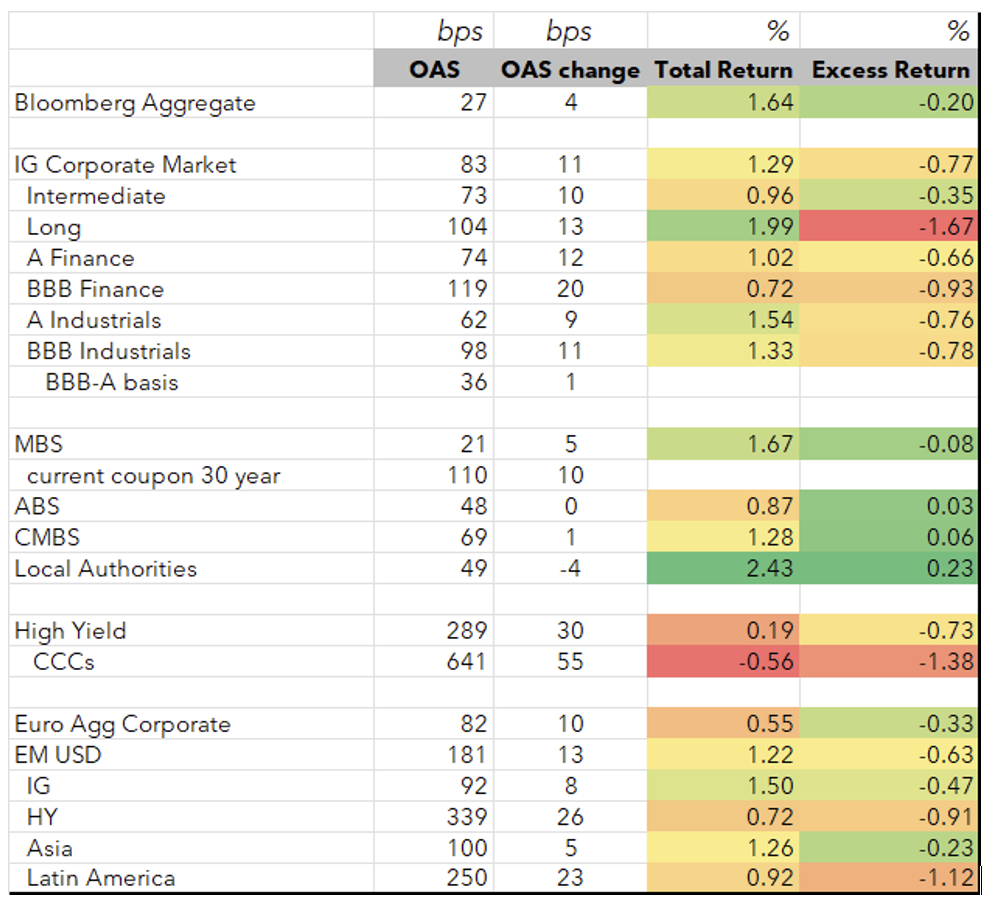
Investment-grade fixed-income markets delivered mixed performance amid rising volatility. Corporate credit spreads widened due to elevated supply, sector‑specific repricing tied to AI‑related disruption concerns, and rising geopolitical risk. Securitized products outperformed corporates, with CMBS and ABS generating positive excess returns despite an active new-issue market, while Agency RMBS lagged as spreads widened after a strong month in January, driven by GSE headlines. Durations shortened in that sector as interest rates fell and the curve flattened. Municipal bonds were a standout performer, benefiting from strong seasonal reinvestment flows, limited supply, and robust retail demand, particularly in the front and intermediate parts of the curve.
IG Fixed Income Recap
Corporate Market
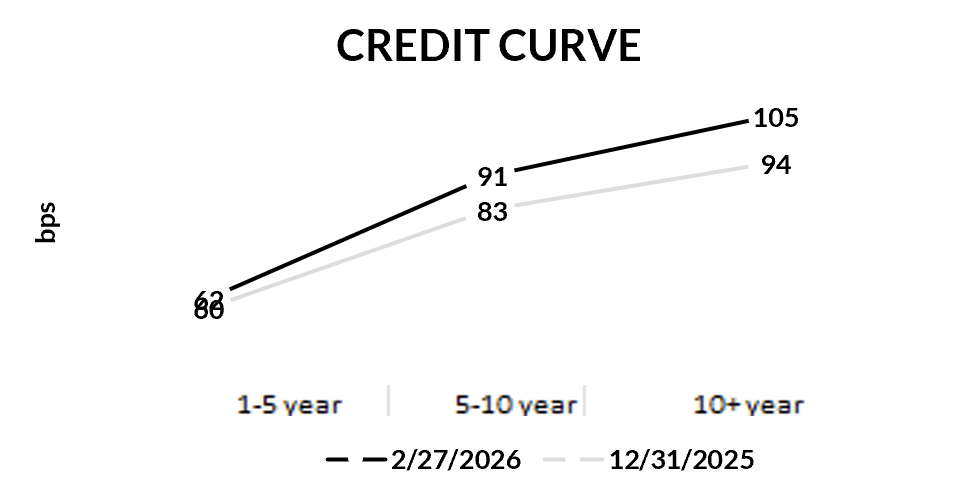
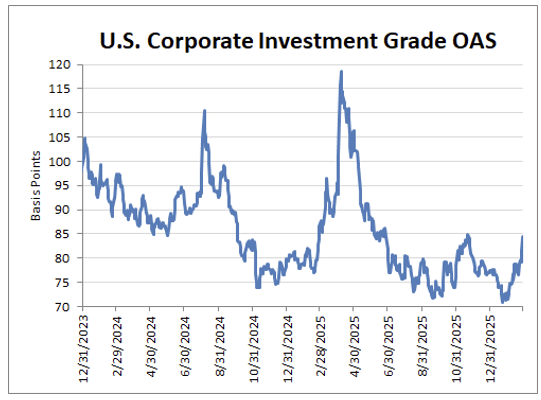
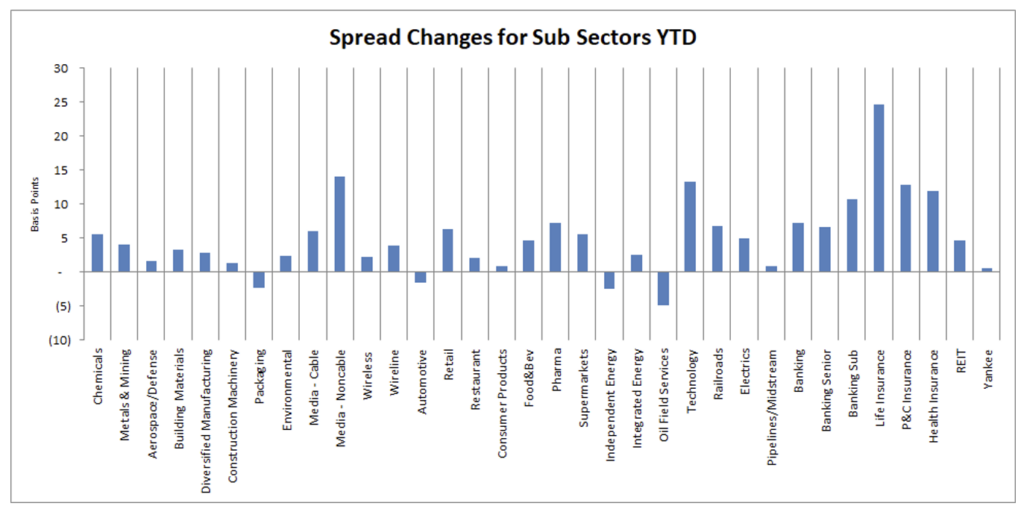
Corporate spreads widened 11 bps wiping out gains year-to-date, driven by (1) another month of heavy new issue supply, (2) risk repricing in companies viewed as negatively affected by AI (e.g., software), (3) BDC and private credit portfolio and redemption worries, and (4) rising geopolitical risk. Risk broadly did not reprice as Industrial BBBs widened by a mere 2 bps vs. As and subordinated banks widened 3 bps vs. seniors. The credit curve steepened as US Treasury yields fell and 30-year corporate issuance has picked up. M&A headlines, specifically debt issued to fund it, remain a driver of spreads. The IEEPA Supreme Court decision was a non-event for the corporate market. The Corporate OAS remains one standard deviation inside its 5 and 10-year averages, respectively (83 vs. 103 and 114).
Looking at sectors relative to Industrials (Sector OAS/Industrial OAS):
- Z scores >1.5: Chemicals, Cable, Technology, Health Insurance, Finance Companies, Life Insurance, P&C Insurance (LTM)
- Z scores <-1.5: Diversified Manufacturing, Metals & Mining, Environmental, Building Materials, Aerospace & Defense, Wireless, Independent Energy, Midstream
Source: Bloomberg, AAM (bold=new for the month; strike-through = no longer valid vs last month; 5+years unless noted for last twelve months)
Corporate Market Technicals and Rating Changes
High-grade fund flows remain strong, and secondary trading volumes are up vs. last year. Secondary trading volumes have averaged a record $45B/day in February, up 18.5% versus the 2025 average.
New issue supply is expected to be $240B in March and $1.8T in 2026. It was $190B in February.
Coupon and maturity income steps up in March, which should be supportive.
Sources: AAM, BAC, JPM
Rating changes this month (rising stars/fallen angels at unsecured level per Bloomberg)
- Fallen angels: Huntsman, Olin, FMC
- Rising stars: Western Digital
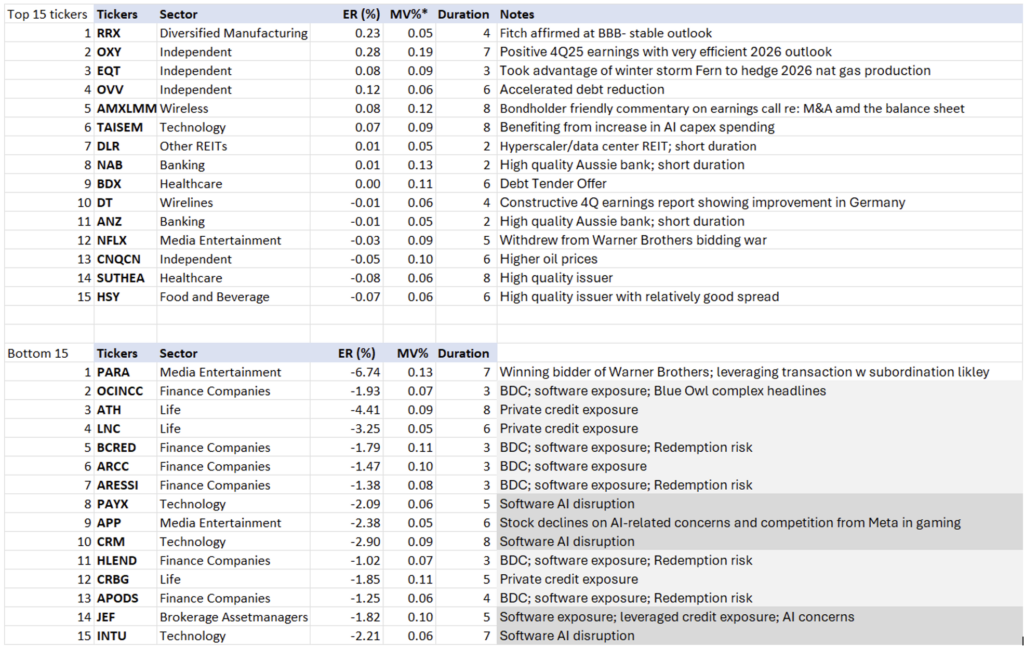
Ticker Level Performance
The following shows the top and bottom performing issuers based on ‘excess return per unit of duration’. This list excludes those with market values less than 0.05% of the Bloomberg Corporate Index as well as emerging markets. AAM’s analysts have provided an explanation for issuer performance when relevant.
Corporate Market Graphs
(Source: Bloomberg, AAM)
Structured Products
By Chris Priebe and Mohammed Ahmed
Agency MBS spreads widened while CMBS and ABS spreads were virtually unchanged, outperforming Corporates
Rating Changes
Rating changes remained negative for CMBS conduit and single-asset deals. More ABS deals were upgraded than downgraded, continuing a positive trend.
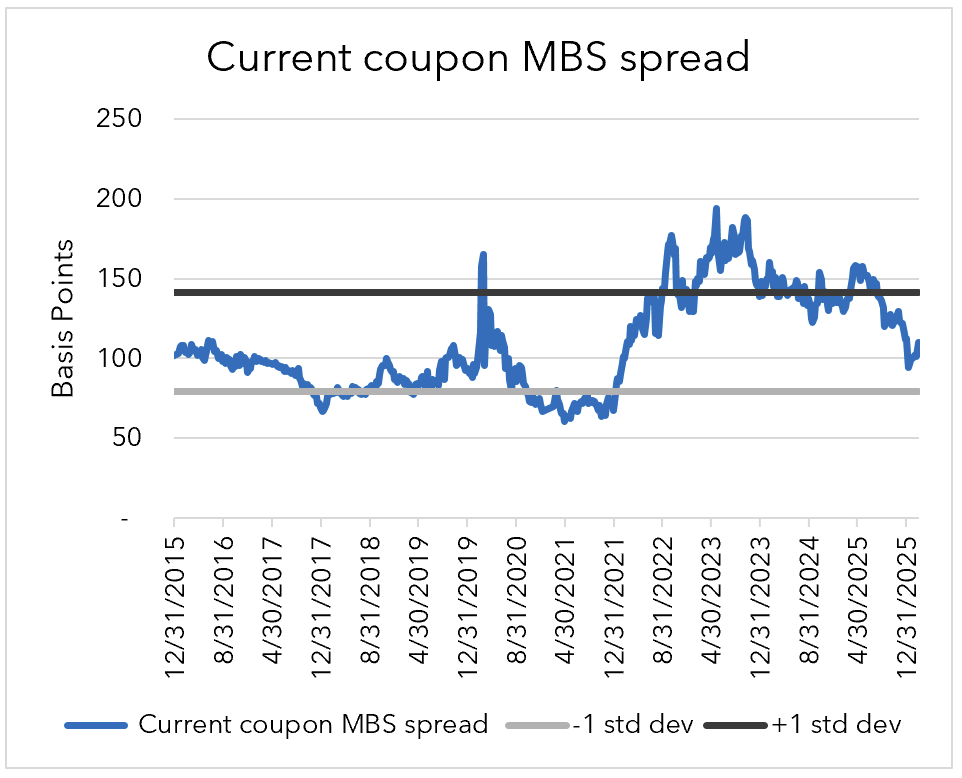
AGENCY RMBS ER -8 bps
Current coupon RMBS spreads produced their first negative excess returns in months, as spreads widened. Durations shortened, anticipating faster prepayments, given the fall in interest rates and flatter curve. Mid-dollar discount coupons in 30-year 3.00’s, 3.50’s, and 4.00’s were the top performers, while 30-year higher coupons (6.5+) also generated positive excess returns, leaving 4.5-5.5 coupons as the underperformers. From a demand perspective, banks were quiet on the month along with Reits. Money managers were the most active buyers in lower-coupon bonds, trying to keep up with index weightings while occasionally adding current-coupon bonds.
CMBS ER +6 bps
CMBS performed relatively well in February, posting +6 bps of excess returns despite a busy issuance month. The market was hit with $18.5 billion in issuance, nearly double the monthly average over the past decade. The issuance trend included a handful of conduit transactions and refinancing of several Single Asset/Single Borrower transactions.
ABS ER +3 bps
ABS issuance was $38.6 billion, posting +3 bps of excess returns. February supply was the heaviest month year-over-year in the last 10 years. The tone from the structured finance conference in Las Vegas was positive for ABS and continues to favor the esoteric sectors that offer value in the ABS universe.
CLO spreads at the AAA level remain unchanged for the month of February at +120. The weakness in the software industry is an overhang for the subordinated tranches given the high proportion of software in underlying portfolios. These loans were down 2 points, with 14% of the software sector trading under $90. The new issue market has already re-worked the composition of the new transactions with average exposure down 2-3% to the software sector.
Sources: Bloomberg (chart: FNCL CC Spread to 5/10), Baird, JPM Index, Moody’s
Municipal Bonds
By Greg Bell, CFA, CPA
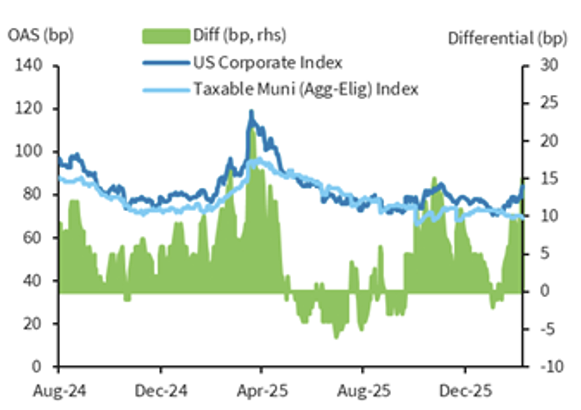
Tax-exempts outperformed due to strong seasonal factors, surging demand and a slowing new issue calendar. Taxable spreads tightened due to the absence of meaningful supply and a stable credit environment.
Taxables
Taxable municipal issuance moderated further in February, totaling $1.79B, down 26% compared to February 2025. The continued absence of meaningful supply, coupled with a stable credit environment, has helped sustain tight spread levels across much of the curve. (Source: BofA, Bond Buyer, Bloomberg)
Demand remains particularly strong in maturities seven years and shorter, though recent trading activity suggests incremental interest extending into the 10-year portion of the curve. Spreads across most maturities were largely unchanged month-over-month. The primary area of softness emerged on the long end of the curve, where spreads widened by approximately 3bps.
Overall, tight valuations continue to reflect limited issuance and consistent institutional demand. While broader rate volatility remains a factor, the technical supply-demand dynamic should continue to provide support to spreads absent a material shift in issuance patterns or credit conditions. (Source: AAM, Bloomberg, Barclays)
Tax-exempts
Favorable seasonal technical factors continued to support the tax-exempt sector throughout February. Strong reinvestment flows of approximately $63B, combined with new issue supply that came in below expectations, produced another month of constructive performance. Municipal yields in 3, 5, 10 and 30-year maturities fell by 15, 14, 11 and 12bps, respectively, reflecting the demand imbalance that persisted during the month. Treasuries rallied more aggressively, with yields in 3, 5, 10 and 30-years declining by 21, 29, 30 and 26bps, respectively. While the Treasury curve bull-flattened by roughly 15bps from 2 to 10-years, the tax-exempt curve modestly steepened by 4bps over the same maturity range. The divergence reflects continued retail demand targeting the short and intermediate portions of the muni curve, while longer maturities lagged modestly on a relative basis. (Source: Bond Buyer, Bloomberg, Refinitiv MMD)
The technical imbalance was evident in the primary market. February new issue supply totaled $34.2B, well below expectations of approximately $44B and nearly flat compared to February 2025 levels. New money issuance, largely associated with infrastructure financing, declined 3% year-over-year. Conversely, total refundings increased by 10% to $9.2B year-over-year, as issuers opportunistically accessed lower absolute yield levels. (Source: Bond Buyer, BofA)
The persistent retail bias toward the front and intermediate portions of the curve has produced notable steepness further out the curve. The slope from 10 to 20-years now stands at 132bps, which is 2.96 standard deviations cheap to its eight-year average. On a relative value basis, that segment of the curve appears historically inexpensive despite overall rich headline valuations.
Mutual fund flows remained supportive during February. The four-week average reached $1.55B per week, following January’s strong $1.583B weekly pace. Continued inflows have reinforced the demand backdrop and helped offset incremental supply. Looking ahead, however, the seasonal technical profile is expected to weaken in March and April. New issuance is projected to average approximately $57B per month, while reinvestment flows are expected to decline to roughly $41B and $37B, respectively. In addition, tax-season related cash needs may further pressure demand as investors raise liquidity for tax-liability payments. (Source: Lipper, Bond Buyer, BofA)
Despite February’s rally, relative valuations remain expensive versus historical norms. Muni-to-Treasury ratios in 10-years ended the month at 63.94%, which is 6.7 percentage points through their five-year average. Municipal tax-adjusted yield spreads (assuming a 21% corporate tax rate) widened by 16bps during the month to -92bps in 10-years. While modestly wider than January’s tight levels, these spreads remain unattractive for insurance companies and other corporate investors. (Source: AAM, Bloomberg, Refinitiv)
U.S. Equity Performance
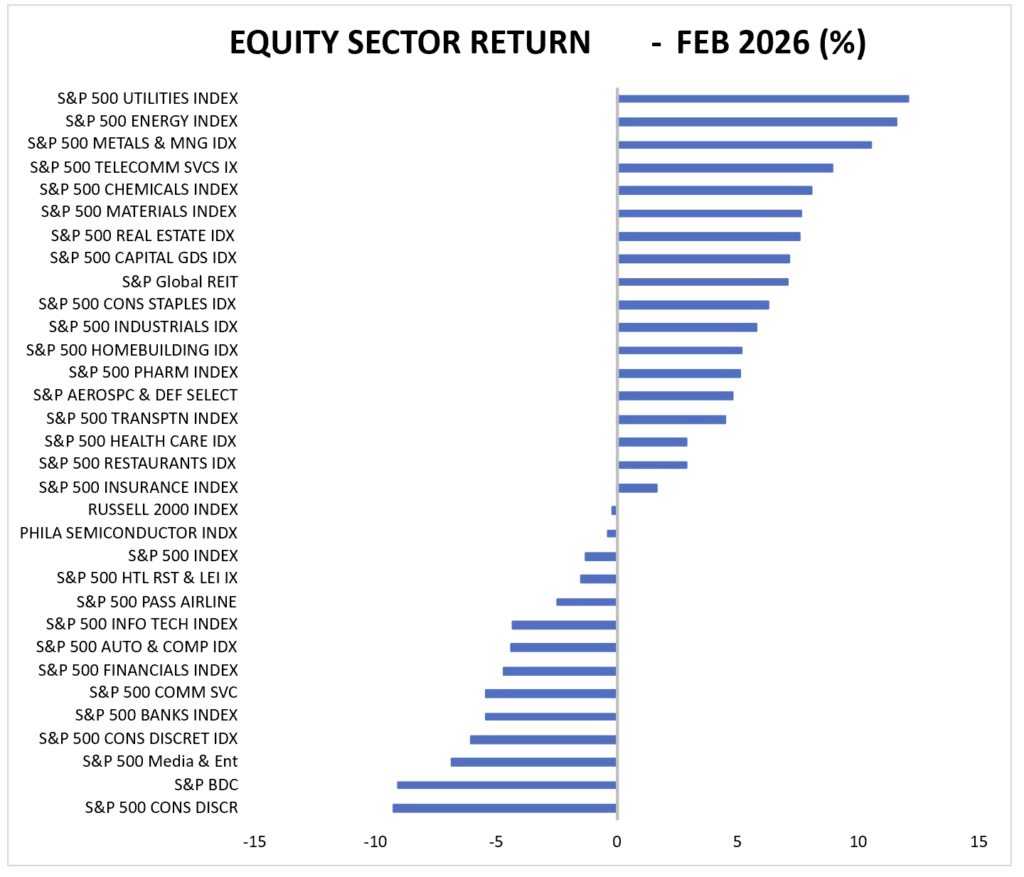


Utilities: Affordability Takes a Prominent Role in an Active Political Year
February 9, 2026