Fixed Income Summary
By Elizabeth Henderson, CFA
Fixed income markets delivered solid performance in January as strong demand technicals, resilient risk appetite, and the market’s ability to absorb heavy issuance supported returns across sectors. Investment-grade corporate spreads tightened to multi‑decade lows, while securitized products strengthened meaningfully, particularly Agency MBS, which benefitted from an announced $200 billion GSE purchase program that drove spreads sharply tighter over the month. Municipal bonds also outperformed amid favorable seasonal reinvestment flows and lighter‑than‑expected supply. A key late‑month development was the nomination of Kevin Warsh as the next Federal Reserve Chair, which introduced policy uncertainty and caused sharp moves in commodities but was largely absorbed by fixed-income markets, with credit conditions remaining firm and risk sentiment intact.
IG Fixed Income Recap
Corporate Market
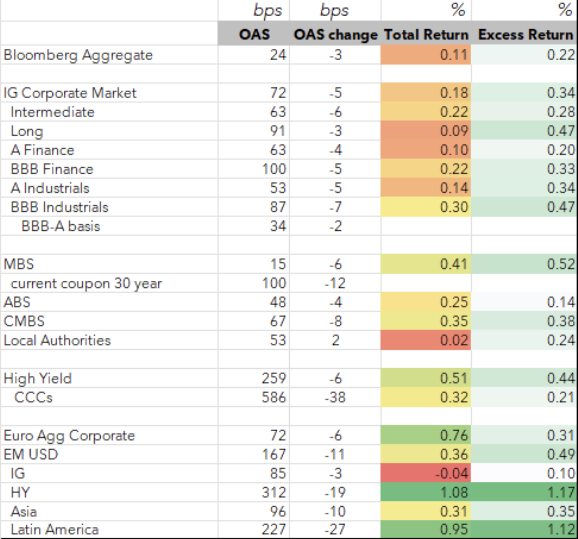
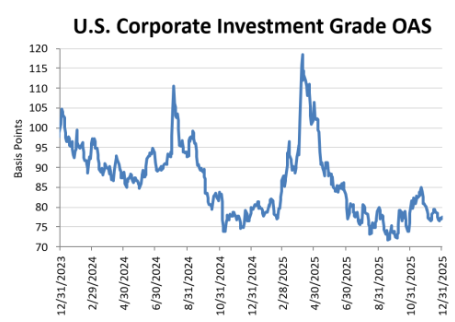
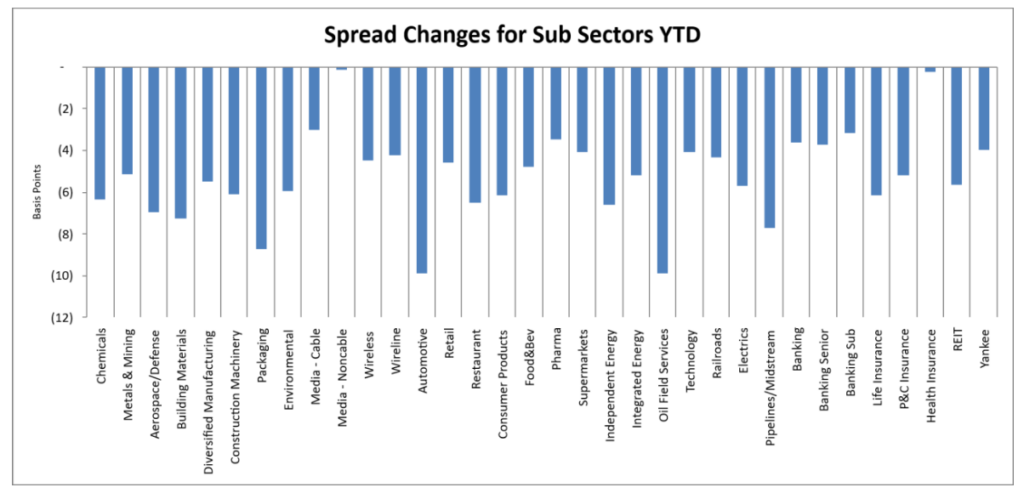
Corporate spreads tightened to levels last seen in 1998, driven by a positive tone towards risk and favorable technicals. Single-A bonds underperformed Triple-Bs, and Autos, Technology and Energy outperformed Retail, Insurance and Healthcare (see ticker level details on the next section). Statistically, Communications, Financials, and Cyclicals are offering more value than Defensive and Commodity-related sectors.
Looking at sectors relative to Industrials (Sector OAS/Industrial OAS):
- Z scores >1.5: Health Insurance, Chemicals, Cable, Technology
- Z scores <-1.5: Diversified Manufacturing, Metals & Mining, Environmental, Building Materials,
REITs,Pharma,Independent Energy, Aerospace & Defense, Retail
Source: Bloomberg, AAM (bold=new for the month; strike-through = no longer valid vs last month; 5+years)
Corporate Market Technicals and Rating Changes
High grade fund flows recorded inflows to US IG bond funds and ETFs at an accelerated pace vs. December.
Despite a record level of trading and investing in January, according to dealer surveys (e.g., BofA), investors are sitting on record levels of cash.
Secondary trading was active in January at $46b/day, 21% higher than last January. 16% of trading was executed through portfolio trades, which is similar to last January.
New issue supply is expected to be $200B in February (4-year average $168B) and $1.8T in 2026.
Sources: AAM, JPM, Citi
Rating changes in December (rising stars/fallen angels at unsecured level per Bloomberg)
- Fallen angels: none
- Rising stars: Frontier, Anchor Packaging, and Calpine (all three due to acquisitions)
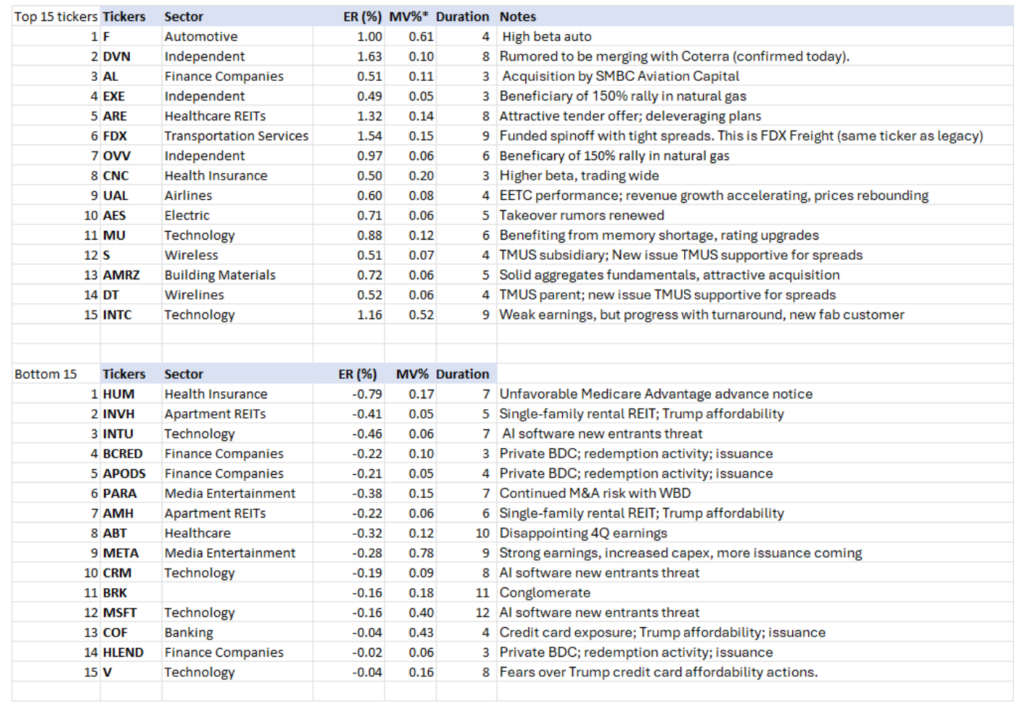
Ticker Level Performance
The following shows the top and bottom performing issuers based on ‘excess return per unit of duration’. This list excludes those with market values less than 0.05% of the Bloomberg Corporate Index as well as emerging markets. AAM’s analysts have provided an explanation for issuer performance when relevant.
Corporate Market Graphs
(Source: Bloomberg, AAM)
Structured Products
By Chris Priebe and Mohammed Ahmed
Agency MBS outperforms once again, while CMBS is a close second in positive excess, while ABS carried humbly.
Rating Changes
Rating changes remained negative for CMBS conduit and single-asset deals. More ABS deals were upgraded than downgraded, continuing a positive trend.
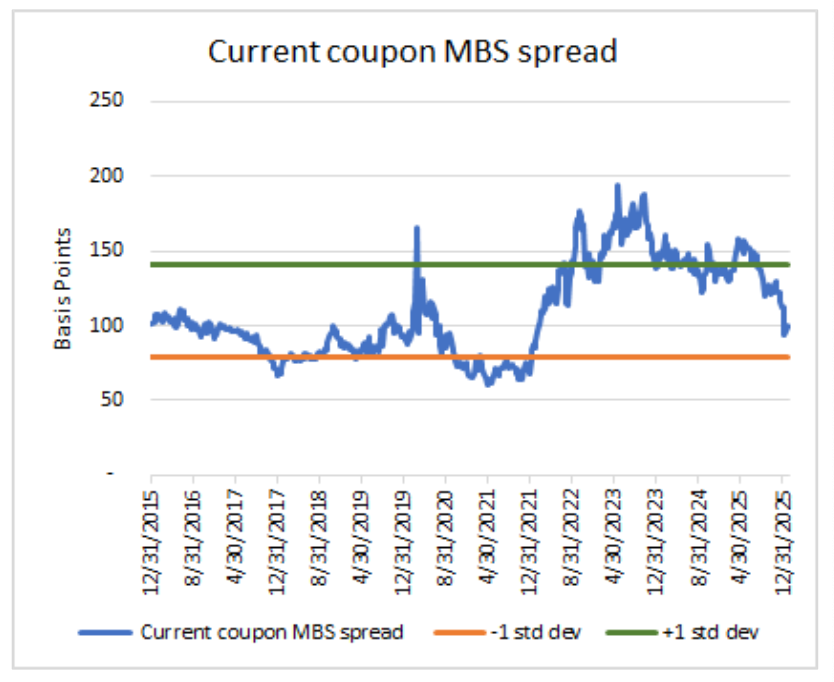
AGENCY RMBS ER 52 bps
Current-coupon RMBS spreads delivered another month of positive excess returns, tightening on GSE- and policy-related headlines. The announcement of $200 billion in GSE MBS purchases drove spreads sharply tighter, narrowing by 13 basis points over the month. Spreads briefly reached a low of 94 bps, a level not seen since early February 2022. Mid-dollar discount coupons, particularly 30-year 4.00%–5.00% bonds, were among the strongest performers, while 30-year 2.50% bonds posted the highest excess return at 81 bps. Ongoing buying from FNMA and Freddie Mac remained concentrated in 30-year 4.00%–5.00% coupons, while money managers increased allocations to 2.50% coupons.
CMBS ER 38 bps
CMBS issuance resumed Post-CREFC in Miami in a very heavy fashion. The new issue market picked up where it left off, setting a January issuance record that was not seen in nearly a decade. Total issuance approached $20 billion, spanning both conduit and Single Asset/Single Borrower (SASB) transactions.
Conduit spreads tightened by approximately 5 basis points across both 5- and 10-year new-issue bonds, finishing just inside 70 bps. The strength of the new-issue market underscores a notably healthy CMBS environment, with ample origination capacity meeting robust investor demand despite a materially higher interest-rate backdrop relative to the prior market peak in 2022.
ABS ER 14 bps
ABS new issue supply was extremely heavy for January. The market digested a stronger-than-usual January supply of nearly $35.4 billion, the month’s second-heaviest issuance of the past decade. January volumes have only averaged $23.3 billion since 2016. ABS-Utility (rate reduction) bonds continued their strong run and outperformed again, leading the way 29bps, followed by Autos and Cards at 15 and 8 bps, respectively, of excess return. The market digested sizeable on-the-run Auto and Equipment deals in January at tight spreads, and they were well oversubscribed.
Sources: Bloomberg (chart: FNCL CC Spread to 5/10), FHN Financial, Barclays
Municipal Bonds
By Greg Bell, CFA, CPA
Tax-exempts outperformed due to strong seasonal factors, surging demand and a slowing new issue calendar. Taxable spreads tightened due to favorable technicals.
Tax-exempts
The strengthening technical profile for the tax-exempt sector was evident during January. The market was buoyed by the favorable seasonal technicals that typically develop during the January/February time period. Surging reinvestment flows of January 1st coupons/calls/maturities, combined with a slowing new issue calendar, led to rates falling by 20, 15 and 13 bps in 3, 5 and 10 year maturities, respectively. Demand technicals were also supported by strong mutual fund inflows, which surged to $2.062 billion in the final week of the month. That increase contributed to a rise in the four-week average by 171% to $1.58 billion compared to the weekly average in December. (Source: Lipper, Bond Buyer, BofA, Bloomberg, Refinitiv)
January new issue supply continued a trend of better-than-expected technicals. New issue supply came in at ~$32B, which was again well-below expectations of $43B for the month. Looking forward over the next two months, favorable seasonal technicals should continue to buoy the sector during February, with heavy reinvestment flows of ~$63B expected to help absorb an expected new issue calendar of ~$44B. However, the favorable technical profile is expected to reverse in March and April as supply is expected to reach an average of $57B per month. (Source: Bond Buyer, BofA)
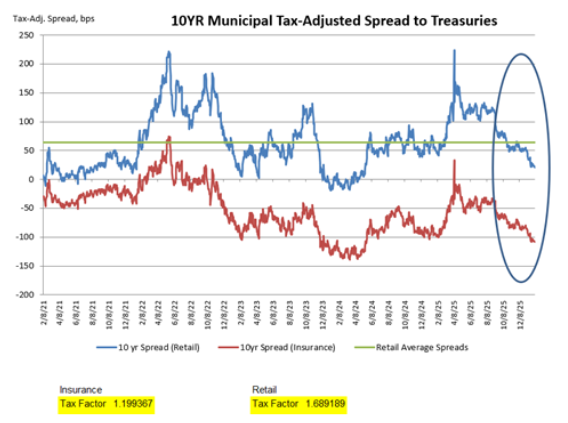
Treasury rates in 10 years increased by 7bps in January, while tax-exempts outperformed. Rates for the sector in 10 years moved lower by 13 bps, resulting in muni-to-Treasury ratios falling by over 4 percentage points to finish the month at 62%. Sector relative valuation levels remain expensive, with 10 year ratios 8.65 percentage points through their 5 year average. Tax-adjusted yield spreads to Treasuries (insurance companies subject to 21% corporate tax rate) tightened by 22bps to end the month at -108bps. (Source: AAM, BofA, Bloomberg, Refinitiv)
Taxables
January spreads performance improved on the heels of favorable techincals. The market continues to be buoyed by a combination of solid demand across the curve, and a low new issuance environment. The sector saw the best improvement in 5, 10 and 30yr tenors, where spreads tightened by 4 to 5bps.
New issuance for January came in at very modest $1.27B, producing a decline of 24% relative to issuance in January 2025. We expect this modest issuance cycle to continue for most of the year and be supportive of current relative valuation levels. (Source: BofA, Bond Buyers, Bloomberg)
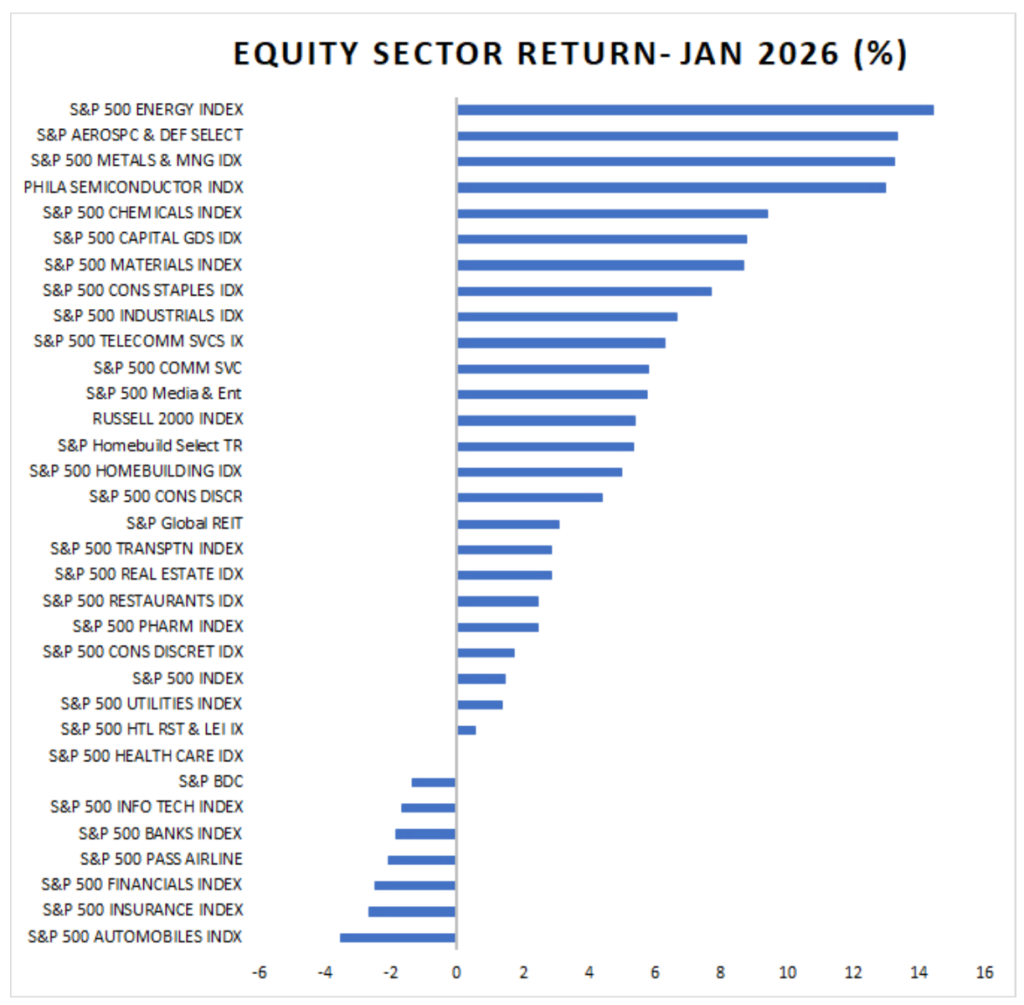
U.S. Equity Performance


Utilities: Affordability Takes a Prominent Role in an Active Political Year
February 9, 2026