
Fixed Income Summary
By Elizabeth Henderson, CFA
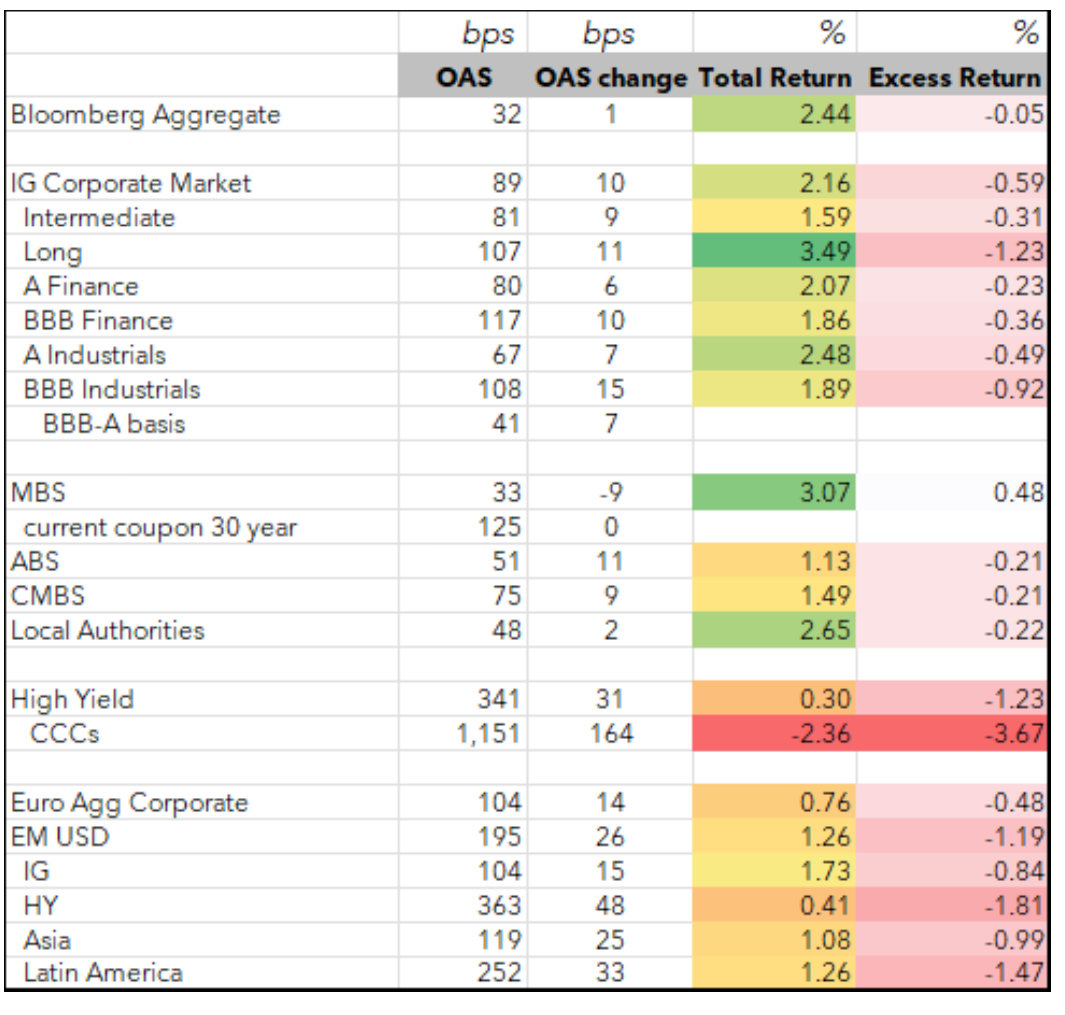
October was a risk-off month in which doubts over the payoff from AI spending, elevated crude and European political stress sent investors toward safety, so bonds beat equities for the first time since March. Mortgages led, followed by Treasuries and IG, with HY and loans trailing and stocks last. Crude and the dollar were the standouts, while EM assets lagged. A dovish October FOMC and the flight to safety pulled Treasury yields sharply lower, though not enough to reverse September’s selloff, while rates volatility lessened. Funding for AI capex is the key supply concern, with the ten largest hyperscalers expected to drive about 80% of global capex growth in 2027. Within high yield, ‘CCC’ spreads have widened considerably, driven in part by distressed credits and heightened investor caution toward the weakest borrowers, which are most exposed to higher-for-longer funding costs and refinancing risk.
Source: AAM, Bloomberg, Goldman; Date range for table: 9/30/26-10/30/26
IG Fixed Income Recap
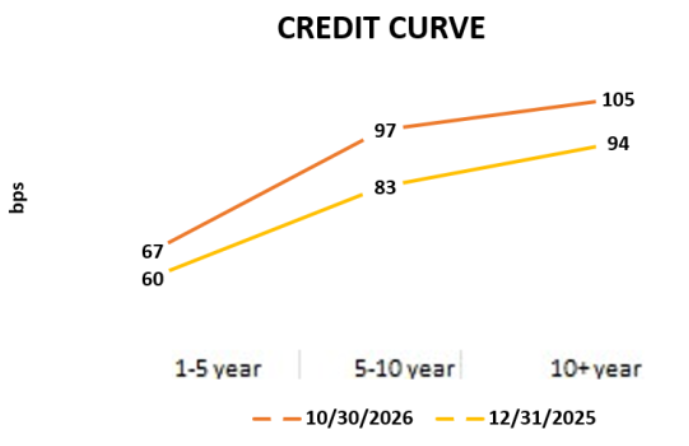
Corporate Market
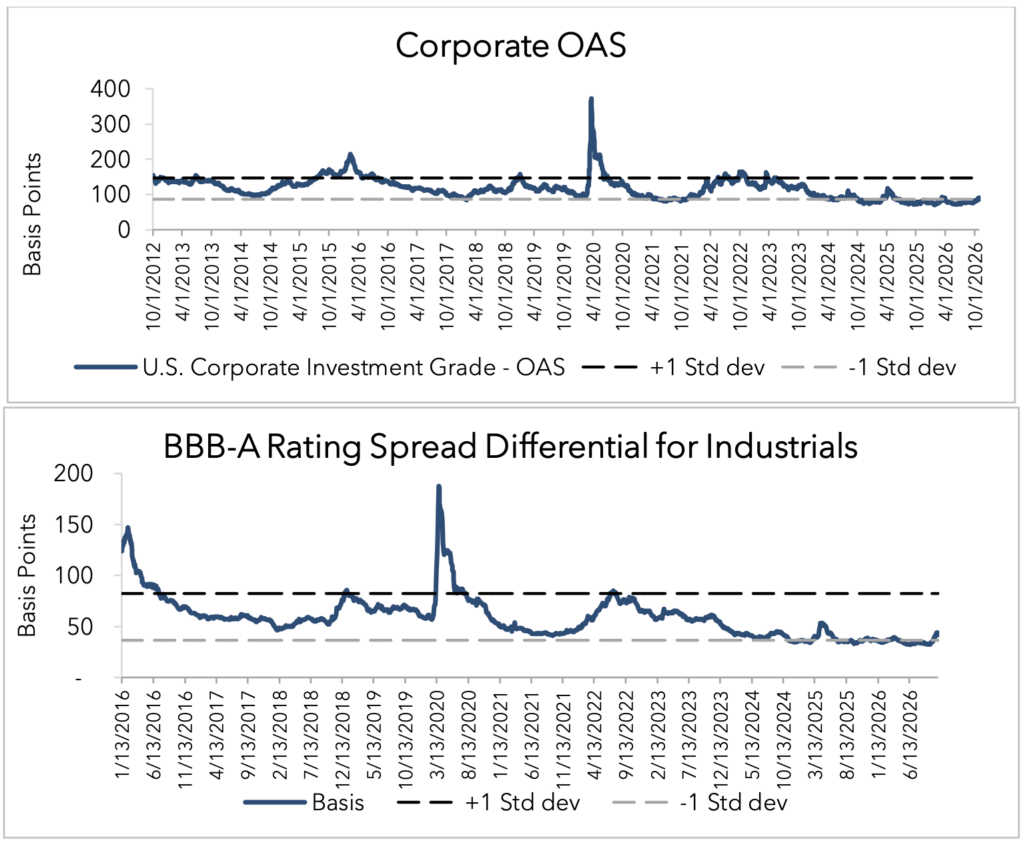
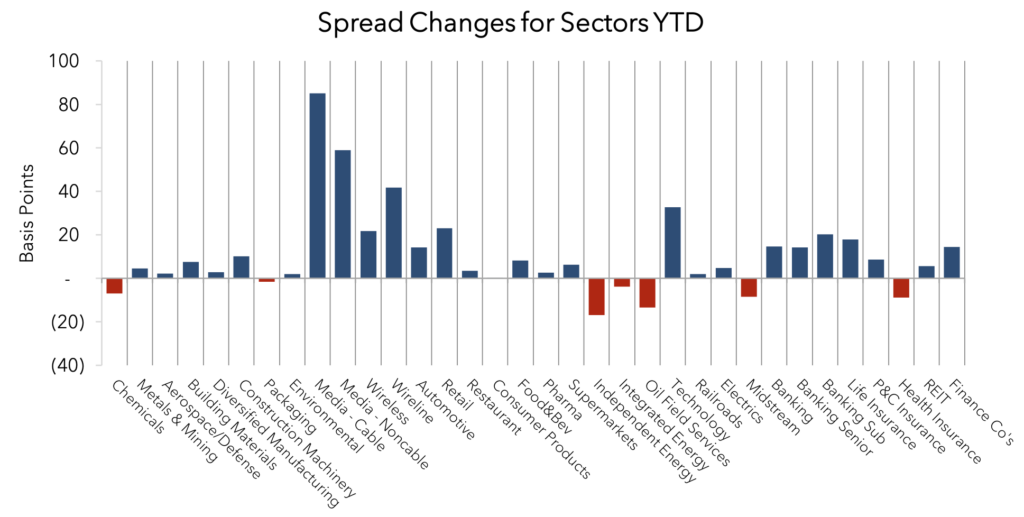
Rates drove strong headline returns while credit weakened. IG spreads widened 10 bps to 90 bps, the largest monthly widening since February, and excess return of -59 bps was also the weakest since February, though the rates rally lifted total return to +2.2%. Volatility shifted from rates in September to AI in October, as concerns about AI profitability and funding, softer hyperscaler earnings, higher oil prices and wider French spreads fueled risk-off sentiment. AI-related sectors drove the underperformance, with Communications widening 34 bps and Technology 21 bps; Cable/Satellite lagged most, while defensive sectors such as Environmental held up best. All 37 industries posted negative excess returns. BBBs and AAs underperformed single-As given hyperscaler exposure, and long-duration credit lagged. More information is included in the table on the next page that highlights ticker-level performance.
Looking at sectors relative to Industrials (Sector OAS/Industrial OAS):
• Z scores >2: Banking, Cable, Wireline, Retail, Technology, Media
• Z scores <-2: Midstream, Pharma, Railroads, Independent Energy, Electric Utilities, Consumer Products, Diversified Manufacturing, Integrated Energy, P&C Insurance, Oil Field Services, Packaging, Environmental, Chemicals, Restaurants
Source: Bloomberg, AAM (bold=new for the month; strike-through = no longer valid vs last month). 5 year period
Corporate Market Technicals and Rating Changes
October high-grade issuance totaled $125B, 17% above the four-year October average and the second highest on record, aided by a $25B MSFT deal near month-end. Year-to-date supply reached $1.82T, up 24% year-over-year. New issues widened 1 bp after pricing but outperformed the index, which widened 11 bps.
Technicals remained constructive: US IG bond funds and ETFs saw net inflows of $15B in October, and average daily HG trading volume was $44.3B, up 14.8% year-over-year. Rating outlooks also stayed supportive, with 2.5% of index bonds on positive outlook/watch versus a 1.6% median since 2010, while negative outlook/watch rose to 2.4% but remains historically low.
Sources: AAM, J.P. Morgan, Bank of America, Wells Fargo
Rating changes this month (rising stars/fallen angels at unsecured level per Bloomberg)
– Fallen angels: none
– Rising stars: United Rentals, Sandisk, Skyworks Solutions
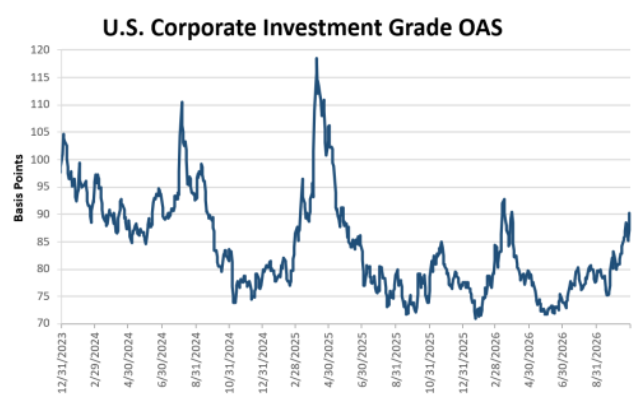
Ticker Level Performance
The following shows the top and bottom performing issuers based on ‘excess return per unit of duration’. This list excludes most with market values less than 0.05% of the Bloomberg Corporate Index as well as non-corporate issuers. AAM’s analysts have provided an explanation for issuer performance when relevant.
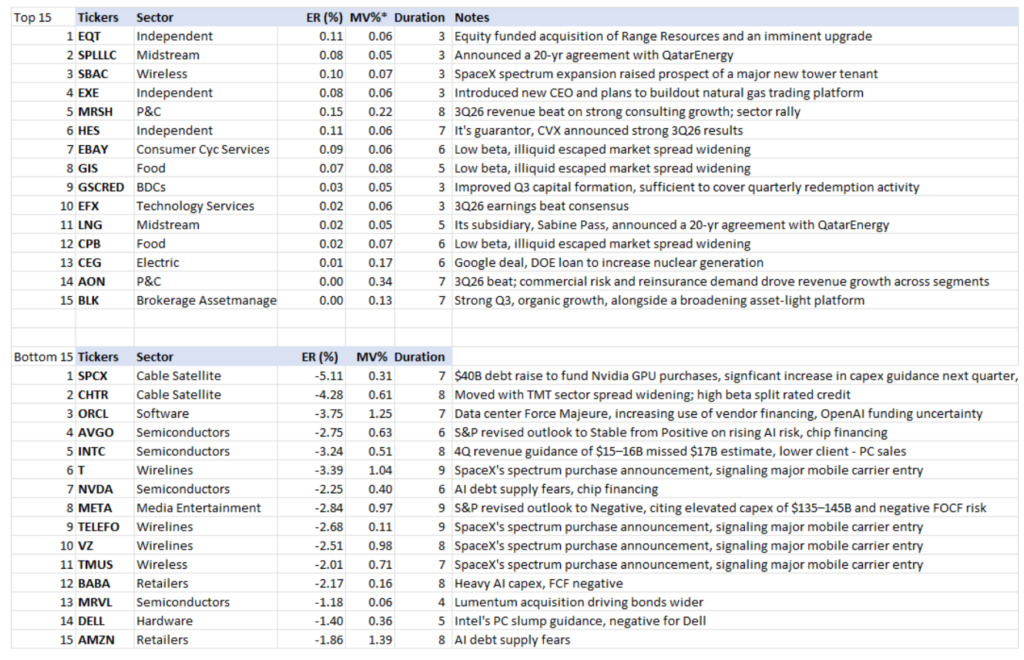
Corporate Market Graphs
(Source: Bloomberg, AAM)
Structured Products
By Chris Priebe and Mohammed Ahmed
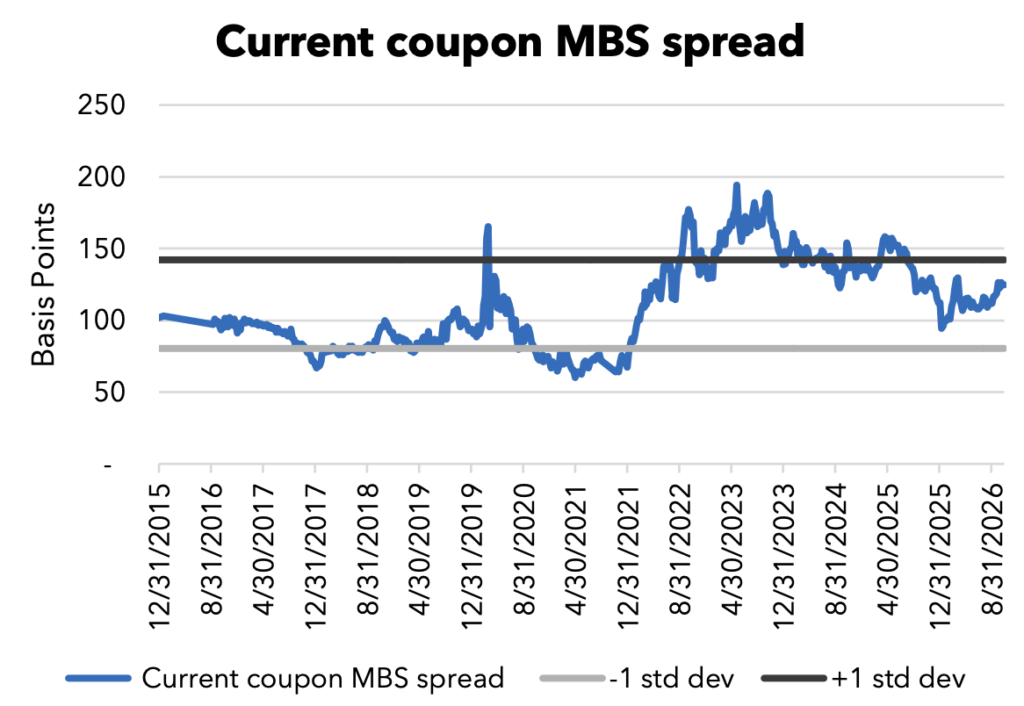
Agency RMBS outperformed in October as falling Treasury yields and lower volatility supported spread tightening. CMBS and ABS posted negative excess returns as spreads widened, while heavy CLO issuance weighed
AGENCY RMBS ER +48 bps
Current coupon RMBS spreads generated positive excess returns in October. Spreads ultimately finished the month approximately 2 basis points tighter after a volatile trading period early in the month. The primary themes throughout October remained interest rate volatility and Treasury curve movement. The 2s/10s Treasury curve flattened modestly, moving from +39 basis points to +32 basis points. Meanwhile, the 10-year Treasury rallied nearly 40 basis points, ending the month at 4.90% versus 5.30% at the start of October. The decline in rates was supportive for agency MBS, particularly as volatility moderated. The MOVE Index fell approximately 9% during the month, creating a more favorable environment for spread products and contributing to broad tightening across the agency MBS market. Performance was strongest in 30-year 3.50s and 30-year 2.00s, which generated excess returns of +79 and +68 basis points, respectively. Non-agency current coupon passthroughs modestly underperformed agency MBS, lagging by roughly 10 basis points and trading 1 to 16 points back during October, as the market absorbed nine new issues.
CMBS ER -21bps
The market backdrop in October was defined by $12.5 billion of CMBS issuance, with supply continuing to skew heavily toward SASB and floating-rate transactions. Only $2.3 billion of new issuance came in conduit deals, while the balance was concentrated in single-asset transactions and CRE CLOs. In the secondary market, spreads widened by roughly 5-7 basis points during October. The Agency CMBS segment outperformed on a relative basis, posting -13 bps of excess return for the month. In contrast, non-Agency CMBS generated -31 bps of excess return, reflecting the broader spread widening across the credit sector.
ABS ER -21 bps
October ABS issuance declined nearly 10% year-over-year to $36.6 billion, though it still represented the third-highest monthly volume of 2026. Supply also exceeded the post-2016 October average of $31.9 billion. Year-to-date issuance has reached approximately $346 billion, up roughly 9% versus the same period last year. Within esoteric ABS, spreads widened by approximately 4-6 basis points during October as markets continued to grapple with inflation concerns and interest-rate volatility. Performance was challenged across several sectors, with Utilities, Credit Card, and Auto ABS generating excess returns of approximately -33 bps, -28 bps, and -13 bps, respectively. CLO spreads also continued to drift wider, increasing roughly 2-3 basis points over the month and finishing in the 125-127 basis point range, compared with about 118 basis points at the start of October. Heavy issuance likely contributed to the weaker technical backdrop, with October CLO supply totaling approximately $39.6 billion.
Source: AAM, Bloomberg, JP Morgan
Municipal Bonds
By Greg Bell, CFA, CPA
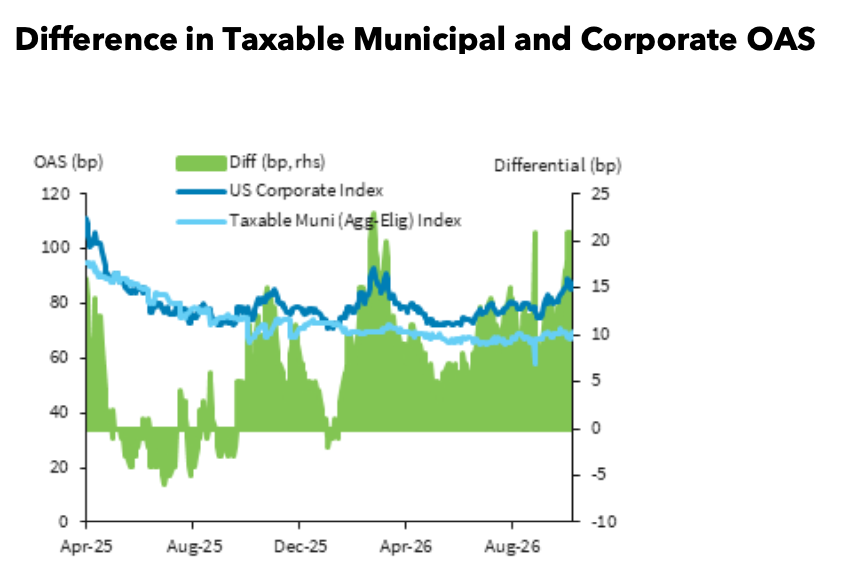
Taxable municipal spreads widened in October, creating an attractive opportunity in longer maturities despite limited supply. Tax-exempts rallied sharply as ETF inflows and lower-than-expected issuance supported the market, erasing relative value for corporate taxpayers while leaving better value for individuals. Year-end technicals remain supportive, although deferred refundings could cap further tightening.
Taxables
Taxable municipal spreads to Treasuries widened again in October, even as tax-exempts richened sharply. AAA spreads ended the month at 26, 38, 42, 48 and 57bps in 3-, 5-, 7-, 10- and 30-year maturities, respectively, wider by 6, 9, 5, 3 and 7bps. Spreads have traded in a tight range all year, and the move has pushed every maturity to the wide end of that range, with the thirty-year matching its spring wides. Measured from the 8 June tights of 10, 18, 22, 38 and 43bps, spreads have widened 10 to 20bps across the curve. (Source: AAM, Bloomberg)
Supply does not appear to be the driver. Taxable issuance totaled $2.95B through 21 October, up 18% year-over-year but less than a tenth of the month’s long-term volume, keeping the scarcity backdrop in the sector intact. (Source: BofA, Bond Buyer, LSEG, AAM)
The widening has restored value that had largely been priced out over the summer. The front end now trades wider than its five-year average by 6 and 4bps in 3- and 5-year maturities, while the ten- and thirty-year points remain through their averages by 12 and 6bps, with the thirty-year having closed half of that gap since the end of September. We view the front end as fairly valued and see better value from seven years and longer. The long end stands out: a 57bp spread on thirty-year AAA paper, paired with the duration of that part of the curve, offers a very attractive entry point, and we view the recent widening as an opportunity to add long-dated taxable munis. (Source: AAM, Bloomberg)
Tax-exempts
October reversed much of September’s damage. Treasuries rallied across the curve, with yields lower by 16 to 38bps, but tax-exempts outpaced them by a wide margin. AAA yields fell 76 to 88bps inside of five years, 71bps in ten years, 64bps in fifteen years and 32bps in thirty years, and the 2-30yr municipal slope steepened 56bps to 215bps as the front end led the rally, retracing September’s flattening. Muni-to-Treasury ratios richened sharply in the intermediate part of the curve, with the five-year falling to 63% from 74% and the ten-year to 69% from 78%, back through its five-year average of 71%. The outperformance stands out in a month that historically ranks among the weakest of the year for both technicals and relative performance. (Source: Refinitiv MMD, Bloomberg, AAM)
Technicals swung back in the market’s favor, and ETFs were the story. Weekly reporting funds took in approximately $6.0B across the four reporting weeks of October, lifting the four-week moving average from -$399mn at the end of September to $1,504mn, against a rolling one-year average of $916mn. The divergence by vehicle that emerged in September widened further. The four-week average of ETF inflows rose from $1.2B to $3.9B, more than offsetting four-week average outflows of $2.4B from open-end funds, which recorded their eighth consecutive week of redemptions; for the month, ETFs absorbed approximately $15.6B while open-end funds lost approximately $9.6B. Supply did its part as well. October issuance had been forecast at roughly $58B, but the higher rate environment and volatility pushed deal flow to a day-to-day basis. Through 21 October, volume totaled $35.6B, down 11% year-over-year, as higher yields pushed outstanding 4.5–5% coupons below par and cut refunding volume by roughly 45%, and the FOMC meeting kept the final week of the month light. We estimate full-month issuance finished in the low-to-mid$40B range, roughly $12–16B short of forecast, turning what had been projected as the least favorable net supply month of the year into one roughly in balance with reinvestment. (Source: Lipper, BofA, Bond Buyer, LSEG, AAM)
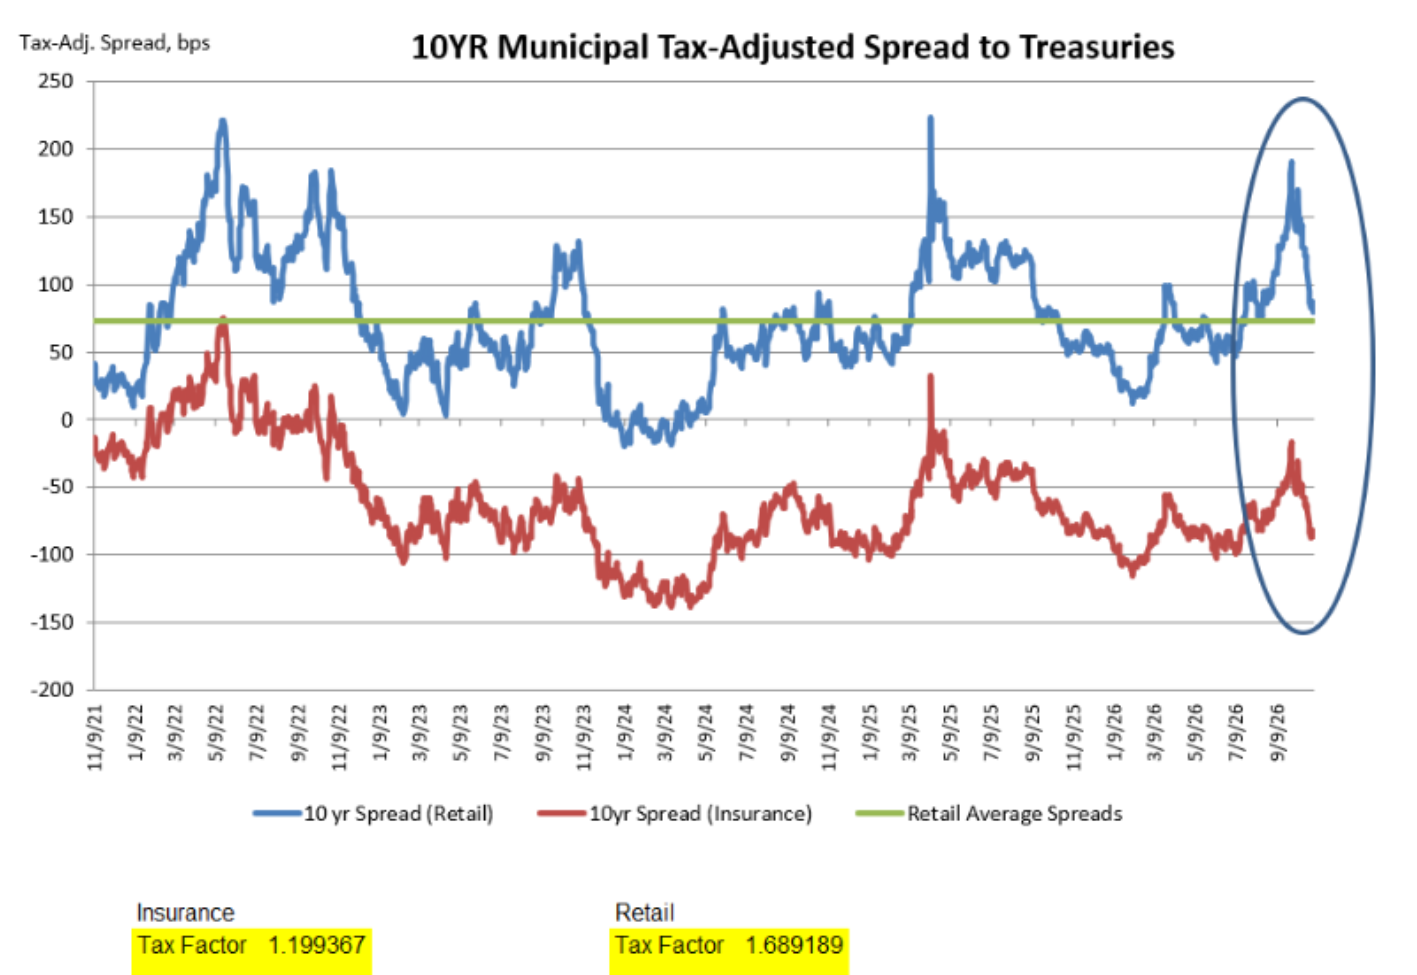
The rally was most consequential on a tax-adjusted basis. Applying the standard gross-up for the 21% corporate rate, spreads to Treasuries tightened by 63, 55, 49 and 6bps in three-, five-, ten- and thirty-year maturities, respectively. The ten-year tax-adjusted spread, which reached -16bps in the final days of September, its narrowest gap to Treasuries since the April 2025 dislocation, ended October at -86bps against a five-year average of -61bps, while the five-year moved to -115bps from -60bps. Fifteen- and twenty-year maturities, which had turned positive at the end of September, have slipped back to -36 and -4bps, leaving the thirty-year as the only point on the curve still offering a pickup to Treasuries, at +46bps. (Source: AAM, Bloomberg, Refinitiv)
A month ago, the sector was approaching the point where institutional investors subject to the 21% rate could make the case for tax-exempts as a Treasury alternative, particularly in the ten-year area. October’s rally closed that window. At current levels, tax-exempts have reverted to being an extremely unattractive sector option for insurance companies and other corporate taxpayers, and the value that remains sits with individual investors, for whom ten-year tax-adjusted spreads are still above their average, consistent with ETF-led demand. The near-term technical backdrop remains supportive, with BofA projecting negative net supply in November and December as reinvestment builds into year-end. The offset is a growing pipeline of refundings deferred by higher rates, which is likely to come to market on any meaningful rally and cap further spread tightening, ahead of a 2027 calendar that BofA expects to include roughly $180B of refunding activity. (Source: AAM, BofA, Bloomberg, Bond Buyer, LSEG, Refinitiv MMD, Lipper)
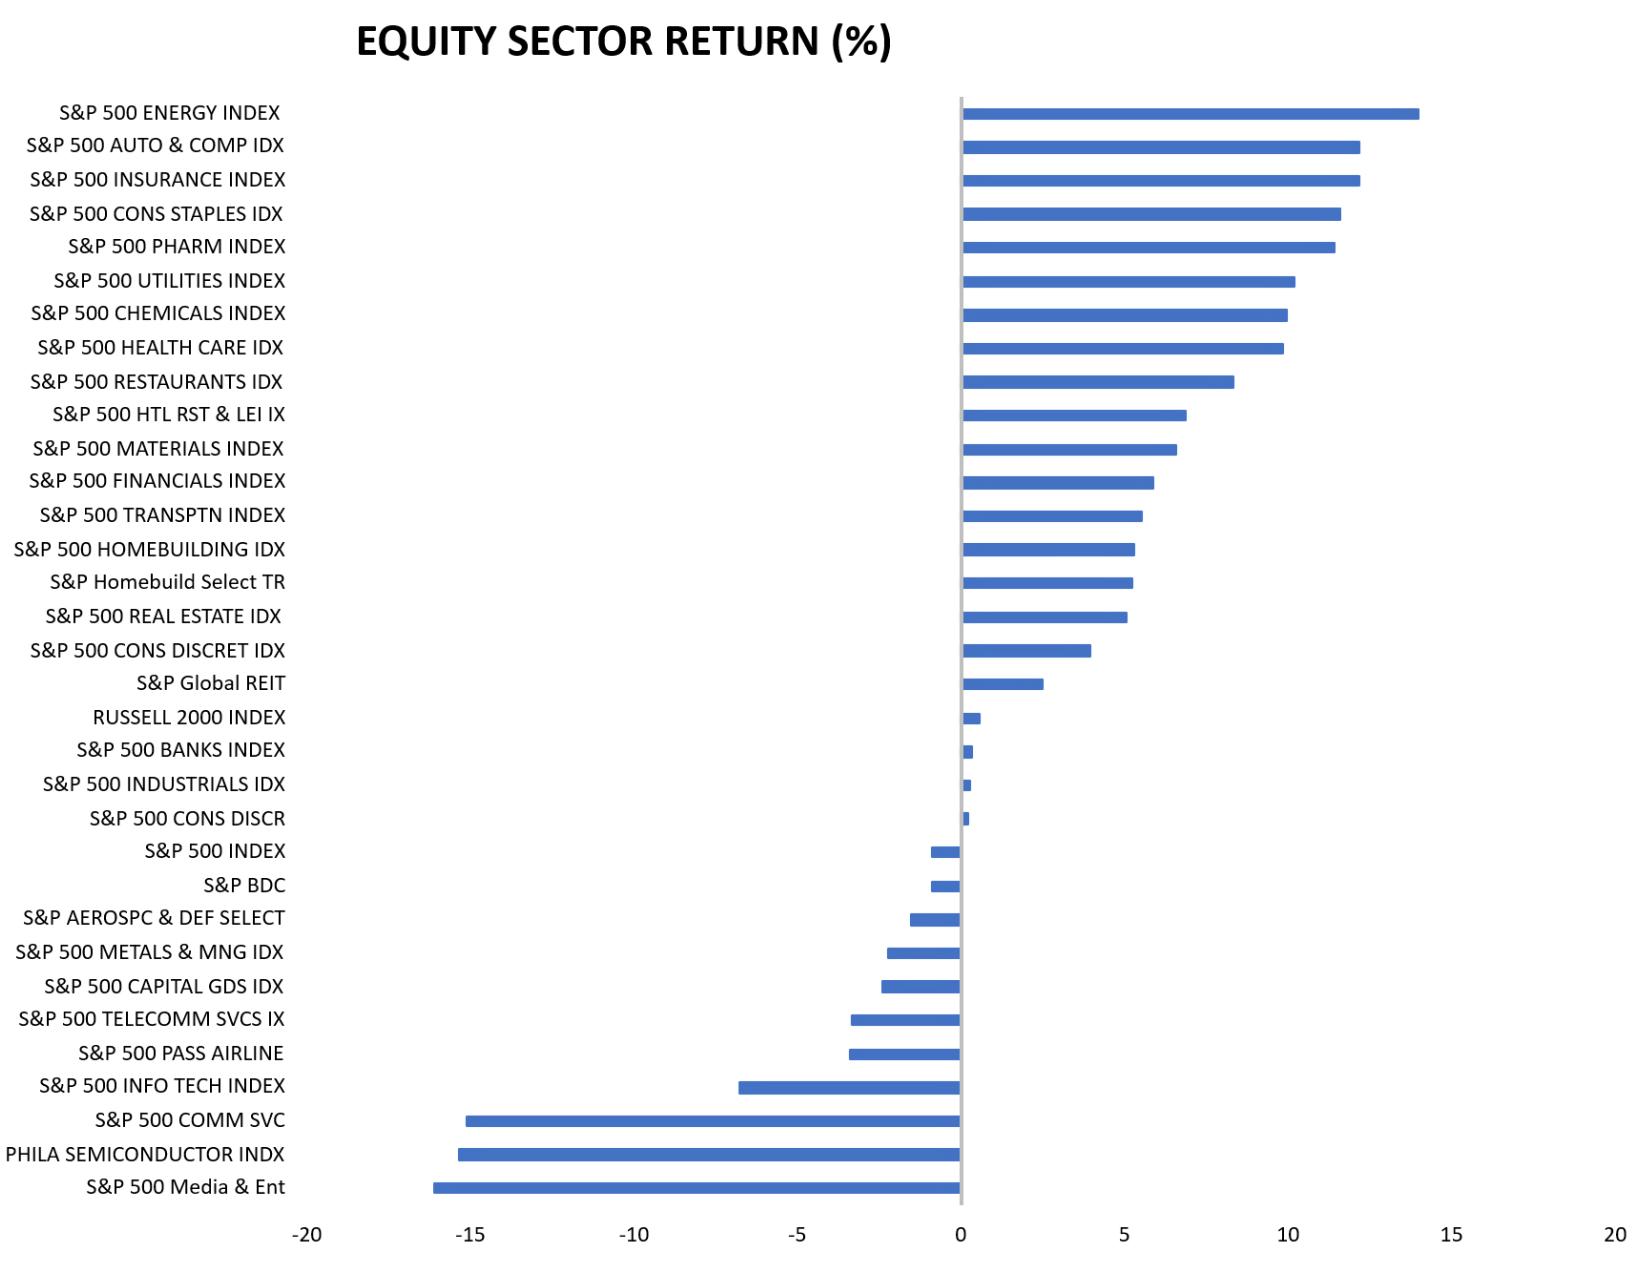
U.S. Equity Performance – October


Corporate Fundamentals 3Q26; Exceptionally Unique Forces Driving Fundamental Strength & Concern
October 19, 2026