Source (data): Bloomberg; Date range: 12/31/2024-12/31/2025
Fixed Income Summary
By Elizabeth Henderson, CFA
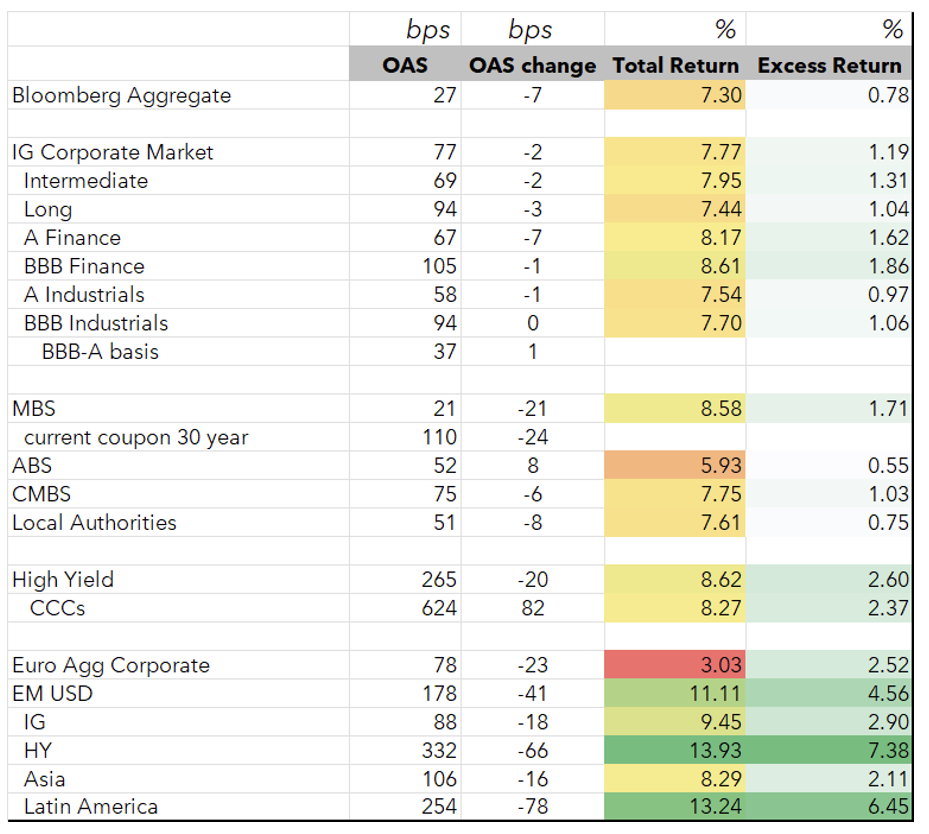
It was a good year for investment grade fixed income markets with positive excess returns vs. Treasuries and total returns in the high single-digits. International markets outperformed domestic fixed income, echoing the trend seen in equities. High yield excess returns were strong despite spread widening in lower rated issues. US IG Corporate OAS ended the year largely unchanged, with BBB issuers generally outperforming, and sector performance driven by fundamentals and heavy AI-related issuance. Full-year corporate issuance reached $1.64T, while high-grade funds saw steady inflows and trading volumes rose 10%. Agency MBS delivered strong excess returns, outperforming other sectors including Corporates in 2025, while CMBS and ABS posted positive but relatively weaker returns. Municipals outperformed on strong technicals, with tax-exempt supply well below expectations and favorable reinvestment flows expected to continue into early 2026, while taxable spreads were modestly wider despite supportive demand.
IG Fixed Income Recap
Corporate Market
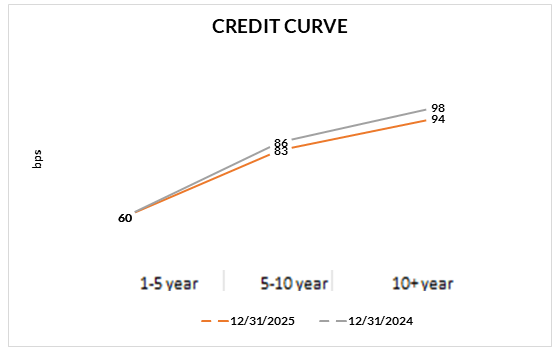
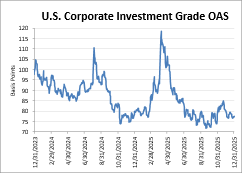
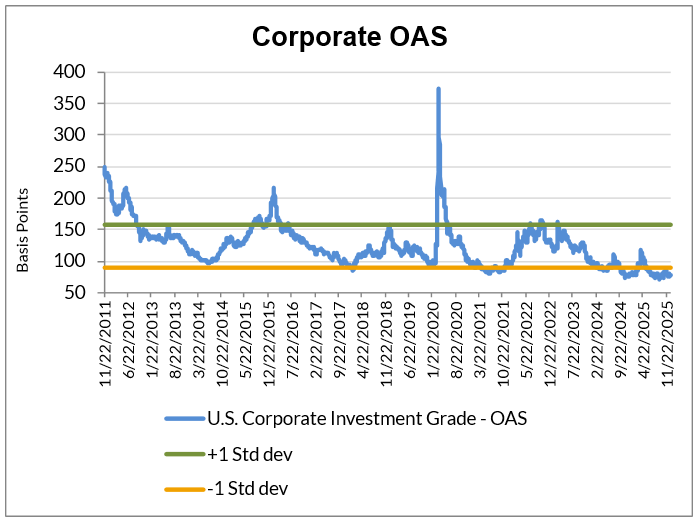
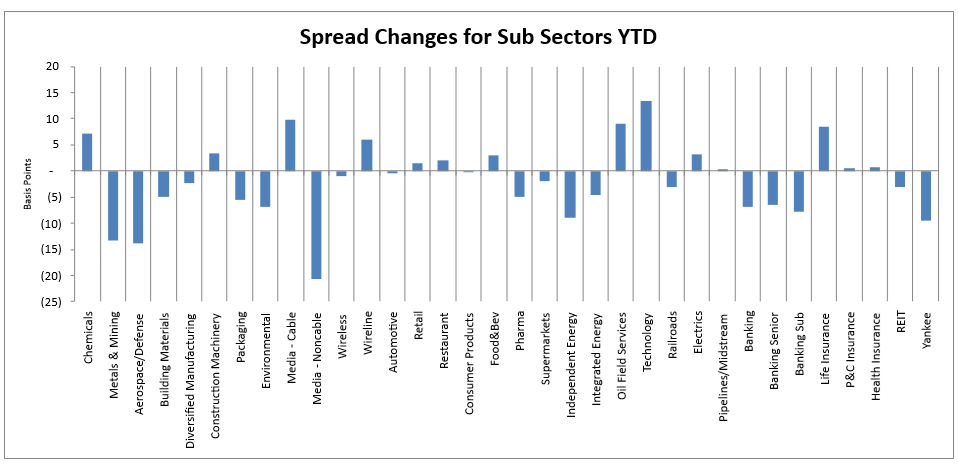
Corporate OAS was modestly tighter in December, but ended 2025 where it started at 78. With spreads little changed, BBB rated issuers generally outperformed higher rated. Except in Financials, longer maturities did not outperform intermediate maturities. Sectors that performed well included Energy, Metals & Mining, Aerospace Defense, Healthcare, Autos, REITS and Banks while those that underperformed included Technology, Media, Cable, Telecom, and Chemicals. Spreads were driven primarily by fundamental performance of the underlying credits in these sectors as well as increased debt issuance for AI-related issuers, pressuring spreads that had gotten historically tight. Debt issuance in 2025 hit $1.64 trillion, the second highest on record, increasing 8% vs. 2024, while net issuance was $616 billion, down 10% vs. 2024.
Looking at sectors relative to Industrials (Sector OAS/Industrial OAS):
- Z scores >1.5: Health Insurance, Chemicals, Cable, Technology,
Life Insurance
- Z scores <-1.5: Diversified Manufacturing, Metals & Mining, Environmental,
Banking (Senior and Subordinate), Building Materials, REITs, Pharma, Independent Energy
Source: JPM, Bloomberg, AAM (bold=new for the month; strike-through = no longer valid vs last month); *Modeled by AAM using a dataset from CapIQ of over 300 IG, non-financial, non-utility companies
Corporate market Technicals and Rating Changes
High grade fund flows recorded inflows every month in 2025 besides April, resulting in an increase in AUM of around 8% vs. 2024. While the long end saw outflows, the short and intermediate parts of the curve had sufficient demand to offset it.
Average daily trading volume was $38B/day, which is 10% higher than last year, while 11% of trading was done through portfolio trades (PTs) vs 10% last year and 6% in 2024.
New issue supply is expected to be $175B in January and $1.8T in 2026.
Sources: AAM, JPM, Citi
Rating changes in December (rising stars/fallen angels at unsecured level per Bloomberg)
- Fallen angels: Televisa
- Rising stars: none
Ticker Level Performance – 2025
The following shows the top and bottom performing issuers based on ‘excess return per unit of duration’ for 2025. This list excludes those with market values less than 0.05% of the Bloomberg Corporate Index as well as emerging markets. AAM’s analysts have provided an explanation for issuer performance when relevant.
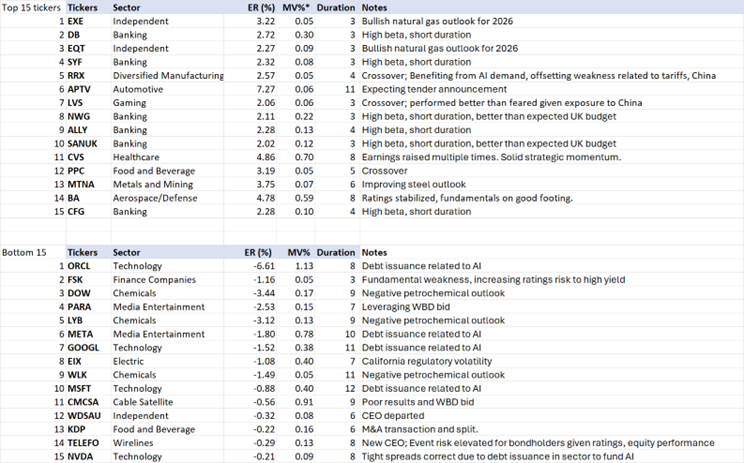
Source (graph, table data): Bloomberg, AAM
Corporate Market Graphs
(Source: Bloomberg, AAM)
Structured Products
By Chris Priebe and Mohammed Ahmed
Agency MBS outperform with discount coupons as the top performers. ABS and CMBS are once again, slightly positive.
Rating Changes
Rating changes continued to be negative for CMBS conduit and single-asset deals. More ABS deals were upgraded than downgraded, continuing a positive trend.
AGENCY RMBS – 2025 ER: 171bps
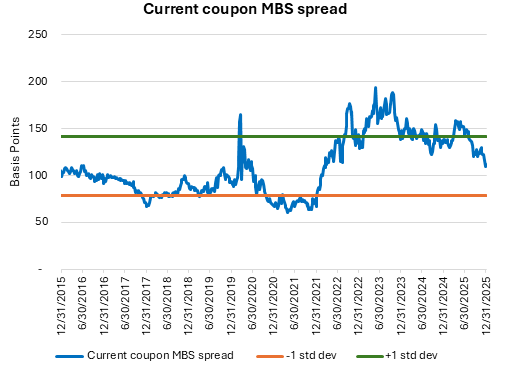
Current coupon RMBS securities produced positive excess returns, closing out the year extremely strong. The Agency MBS OAS in the Bloomberg Index was 16 basis points tighter on the month. It started the year near +140 and closed near +110, hitting a low of +108 in late December. In terms of excess returns vs. Treasuries, low dollar discount coupons in 30 year 3’s through 5.50’s were the top performers in 2025, while 15 years and higher coupon 30 years underperformed. Money managers were very active in 30 year 4.50’s and 5.00’s in December. FNMA and Freddie Mac were uniquely active in 30 yr 3.00’s and 3.50’s, making agency MBS the top performers of the mainstream Indices.
CMBS – 2025 ER: 103 bps
Despite producing positive returns, CMBS underperformed other fixed income sectors, posting 8 bps of excess returns in December and 103 bps in 2025. Spreads on 5 and 10 year conduits held steady in the mid to high 70s and low 80s, respectively. Non-Agency CMBS outperformed Agency CMBS in 2025 due to the tightening in Non-Agency spreads and higher OAS. While Agency issuance had consistently exceeded Non-Agency levels in the years following Covid, 2025 saw a balance between the two. Looking ahead, Barclays anticipates that Non-Agency CMBS issuance will outpace Agency issuance in 2026. In 2025, the supply of single borrower deals (SASB) surpassed conduit issuance. This trend that began post-COVID, is projected to persist into 2026. Lastly, BBB rated CMBS underperformed in part due to principal losses on earlier-vintage bonds and as obsolescence in malls and office has increased the number of properties that no longer qualify for stabilized financing.
ABS – 2025 ER: 55 bps
ABS new issue supply was heavy in early December with $9 billion, as YTD new issue supply was close to $370 billion, 9% higher year-over-year. ABS-Utility (rate reduction) performed the best in December, followed by Autos and Cards. However, Utility ABS lagged in 2025. CLO AAA spreads were basically unchanged in December. New supply is near $182 billion in 2025 for the CLO market, and secondary trading volume is up 22% year-over-year. ETF demand and the lack of net issuance supported the sector in 2025. CLO total returns were comparable to fixed alternatives in 2025.
Sources: Bloomberg (chart: FNCL CC Spread to 5/10), FHN Financial, Barclays
Municipal Bonds
By Greg Bell, CFA, CPA
Tax-exempts outperformed due to strong technicals, which are expected to continue into early 2026. Taxable spreads were modestly weaker despite supportive technicals.
Tax-exempts – December supply continued a trend of better-than-expected technicals. New issue supply came in at ~$35B, which was again well-below expectations of $47B for the month. It was also ~28% below the monthly $48.6B average for the first 11 months of the year. Demand also accelerated from the onset of heavy December 1st reinvestment flows of ~$53B. Mutual funds also continue to be supportive with inflows producing a weekly average of $271M through the first 3 weeks of the month. However, this segment has slowed by 72% relative to the weekly averages during September and October. For the year, new issue supply is projected to end the year at $560B for a ~14% increase over 2024, producing a new record of issuance. (Source: Refinitiv, Bloomberg, Lipper, BofA)
Favorable seasonal technicals should continue to buoy the sector over the first two months of the new year. Reinvestment flows are expected to improve to their second highest levels of the year during the January and February timeframe. (Source: Bond Buyer, BofA)
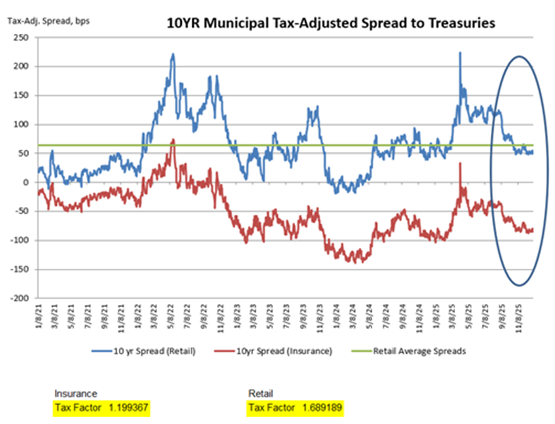
Treasury rates in 10yrs increased by 17bps in December, while tax-exempts outperformed. Rates for the sector in 10yrs moved higher by 1bp, resulting in muni-to-Treasury ratios falling by over 2.29 percentage points to finish the month at 66.20%. Sector relative valuation levels remain expensive, with 10yr ratios 13.7 percentage points through their 8yr average. Tax-adjusted yield spreads to Treasuries (insurance companies subject to 21% corporate tax rate) tightened by 14bps to end the month at -86bps.
For the year, 10yr tax-exempt rates fell by 30bps, while Treasury rates over the same period fell by 40bps. Muni-to-treasury ratios were fairly balanced, with ratios remaining almost unchanged year-over-year. However, 10yr tax-adjusted yields to Treasury spreads over the year widened by 4bps. (Source: AAM, BofA, Bloomberg, Refinitiv)
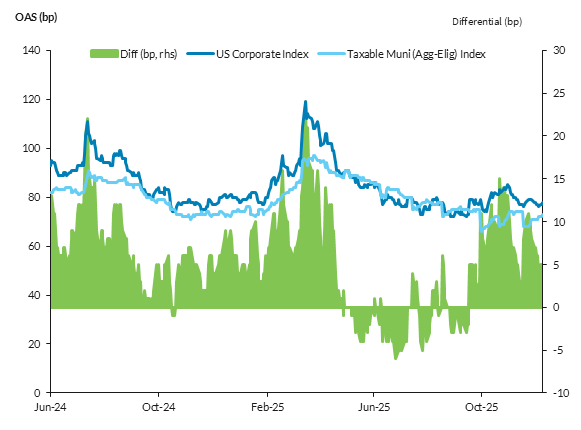
Taxables – December spread performance was essentially unchanged. The market continues to be buoyed by a combination of solid demand across the curve and a low new issuance environment. Spreads for the year were wider across the curve, with the intermediate areas exhibiting the worst performance. Spreads moved wider by 1, 12, 10, 4 and 5bps in 3, 5, 7, 10 and 30yrs, respectively.
New issuance for December came in at very modest $1.6B, producing a decline of 42% relative to issuance in December 2024. For the year, taxable issuance is projected to produce $49B for a year-over-year increase of 32% versus 2024. (Source: BofA, Bond Buyer, Bloomberg) (Source for chart below: Bloomberg, Barclays)
U.S. Equity Performance
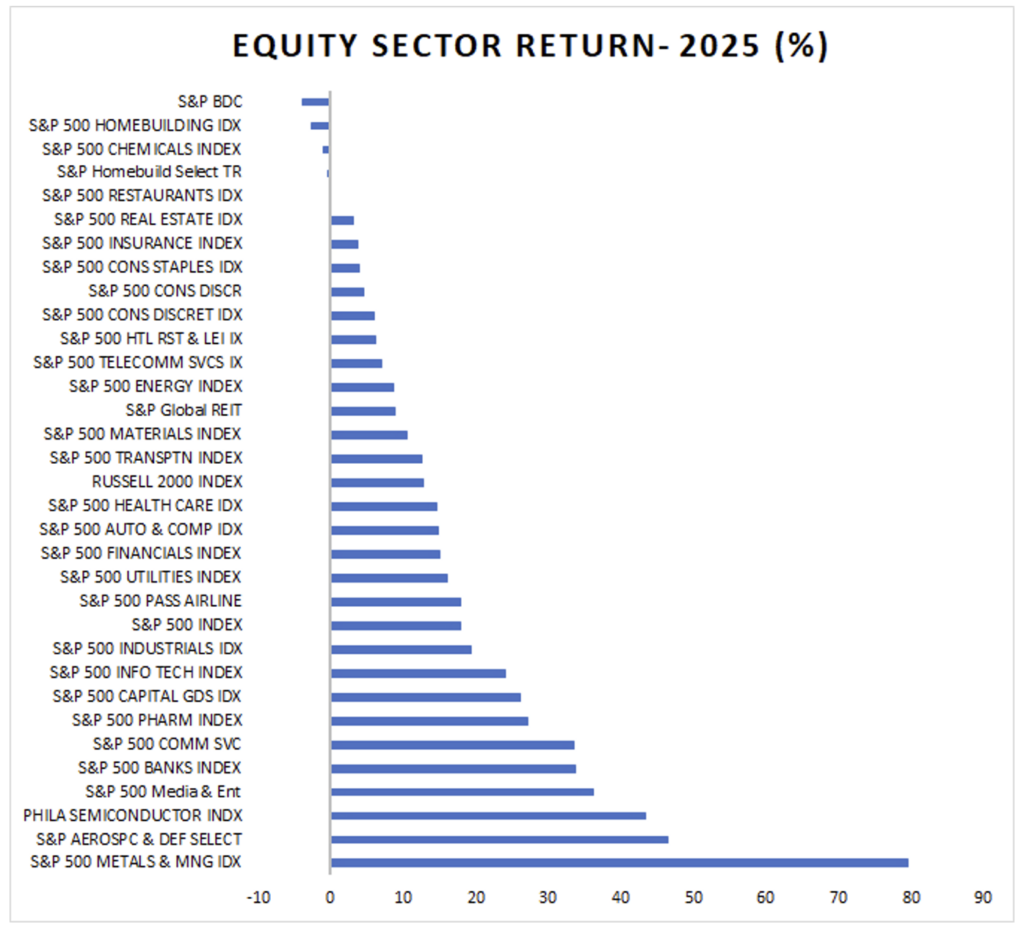
Source: Bloomberg, AAM


Middle East Ceasefire: What Has Changed for Energy Fundamentals and What Hasn’t
April 8, 2026