
Fixed Income Summary
By Elizabeth Henderson, CFA
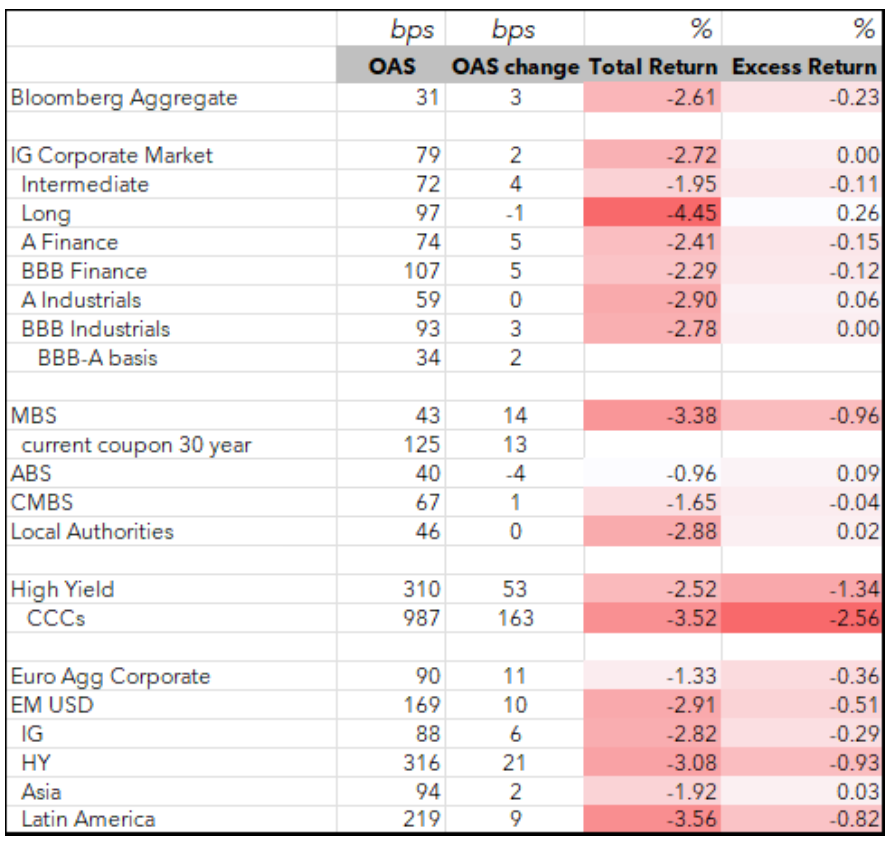
September’s global bond selloff reflected concerns about heavy government borrowing, persistent inflation, higher energy prices, and tighter-for-longer monetary policy; investment-grade credit remained comparatively resilient, but high-yield spreads widened considerably and rising rates extended agency MBS durations, prompting duration-sensitive investors to rebalance through Treasury sales or swaps. Elsewhere, structured products generally held up better than longer-duration sectors, taxable municipals outperformed tax-exempts, and compressed equity risk premiums left stock valuations increasingly dependent on strong earnings growth and an eventual decline in interest rates. Corporate fundamentals remain supportive as earnings margins continue to expand, defaults trend lower, and analyst credit views across sectors remain predominantly stable.
IG Fixed Income Recap
Corporate Market
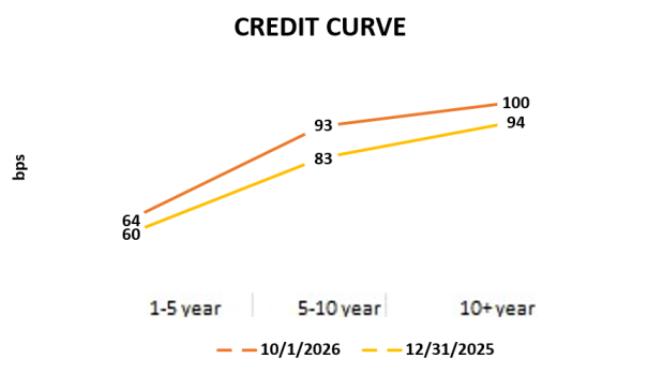
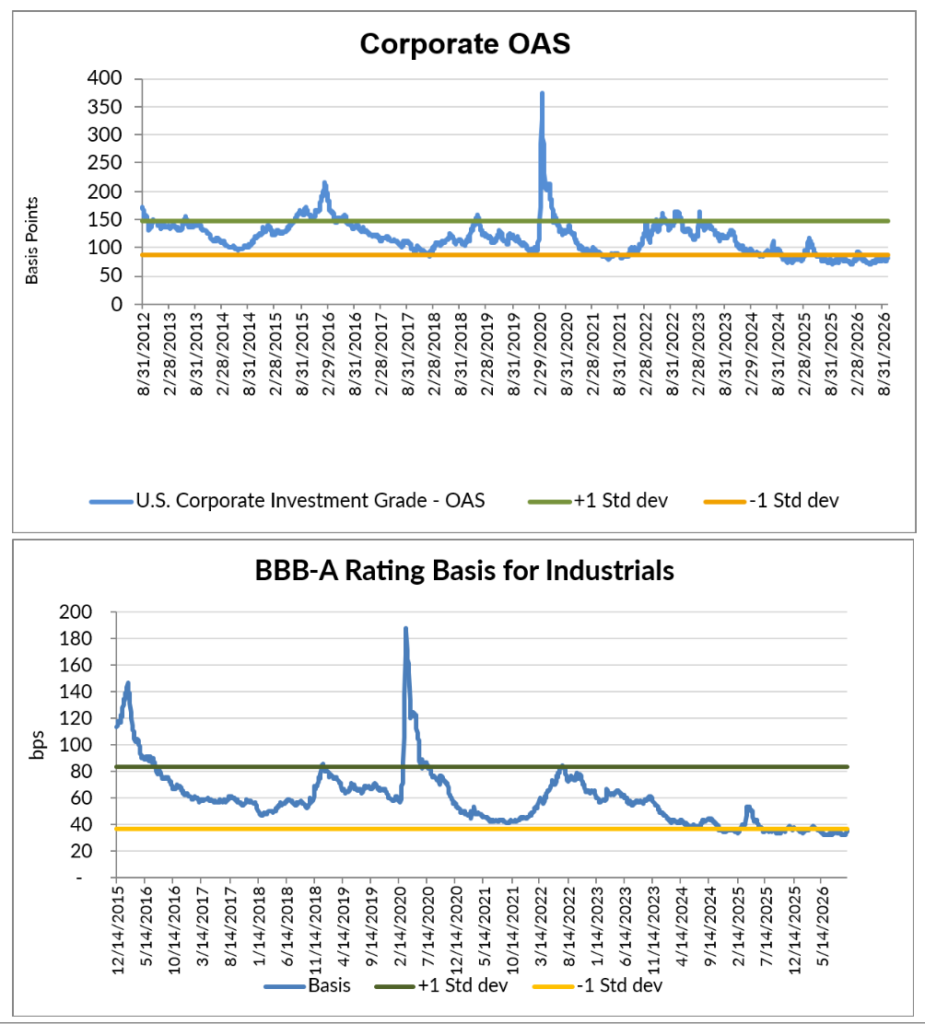
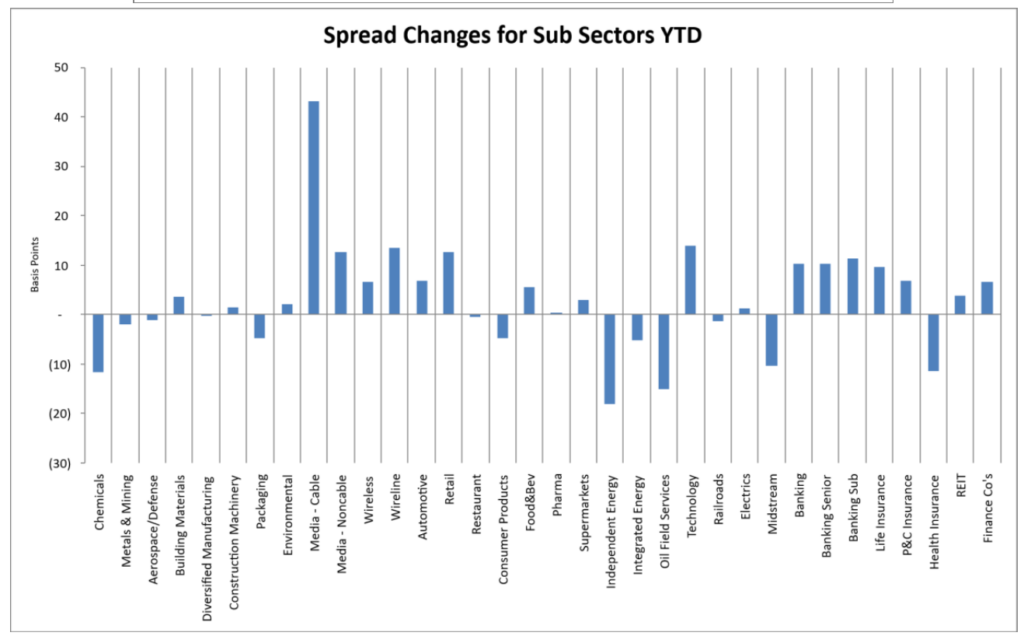
Despite the rate-driven selloff, corporate credit remained remarkably resilient. Investment-grade spreads widened 1-3 basis points during September, and excess returns were roughly flat, highlighting the strength of underlying credit fundamentals and investor demand. JPMorgan noted that September’s total return for IG Corporates ranked in the bottom 5% of monthly returns over the past decade, yet spread performance held up far better than would typically be expected in such a difficult rate environment. Sector performance was mixed during September. It’s worth noting that Bloomberg recently updated its index sector classifications, resulting in some issuers and securities being reassigned across sectors. A new Technology-related sector led the market, Computer Hardware, and Diversified Media posting the strongest spread performance given the long-anticipated Paramount split-rated new issue. Cyclical and financial-oriented sectors lagged, including Automotive, Leisure, and Cable. More information is included in the table on the next page that highlights ticker-level performance.
Looking at sectors relative to Industrials (Sector OAS/Industrial OAS):
• Z scores >1.5: Banking, Cable, Wireline, Retail, Technology, Media
• Z scores <-1.5: Independent Energy, Midstream, Aerospace & Defense, Restaurant, Packaging, Chemicals, Diversified Manufacturing, Oil Field Services, Metals & Mining, Environmental
Source: Bloomberg, AAM (bold=new for the month; strike-through = no longer valid vs last month).
Corporate Market Technicals and Rating Changes
September high-grade corporate issuance reached a record $198B, 34% above the average September pace, while year-to-date supply rose to $1.7T, up 30% year-over-year. Despite the elevated supply backdrop, spreads remained remarkably resilient, underscoring continued investor demand for high-quality corporate credit.
Market technicals remained constructive as investment-grade mutual funds and ETFs generated $16.5 billion of net inflows during September. Trading activity also remained robust, with average daily investment-grade volume of $43.7 billion, modestly above year-ago levels. The combination of continued inflows, healthy liquidity, and strong issuance absorption helped support credit spreads despite a challenging backdrop for rates.
Sources: AAM, J.P. Morgan Daily Credit Strategy Update
Rating changes this month (rising stars/fallen angels at unsecured level per Bloomberg)
– Fallen angels: Flowers Foods
– Rising stars: Newmark Group
Ticker Level Performance
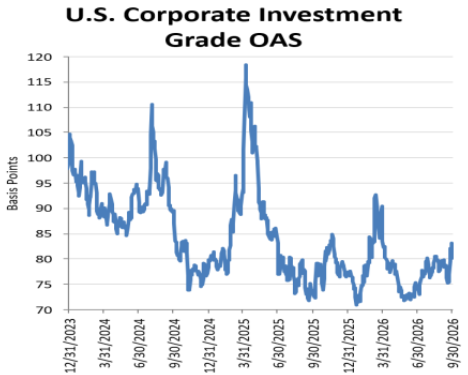
The following shows the top and bottom performing issuers based on ‘excess return per unit of duration’. This list excludes most with market values less than 0.05% of the Bloomberg Corporate Index as well as non-corporate issuers. AAM’s analysts have provided an explanation for issuer performance when relevant.
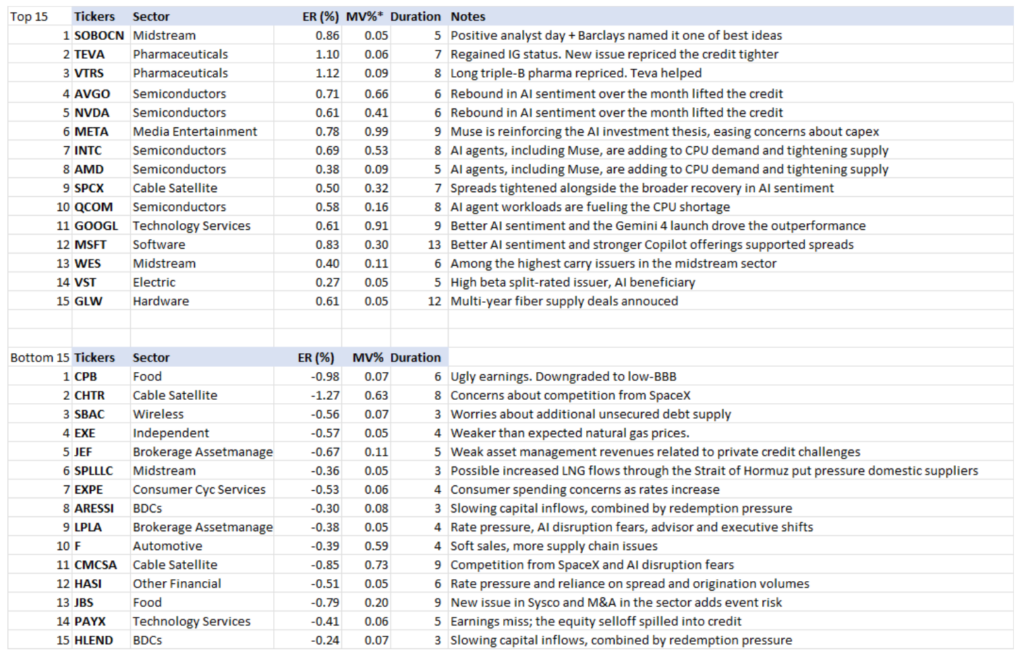
Corporate Market Graphs
(Source: Bloomberg, AAM)
Structured Products
By Chris Priebe and Mohammed Ahmed
Agency RMBS underperformed in September as rising Treasury yields widened spreads and extended mortgage durations, while ABS posted modest gains and CMBS was nearly flat.
AGENCY RMBS Excess Return: -96 bps
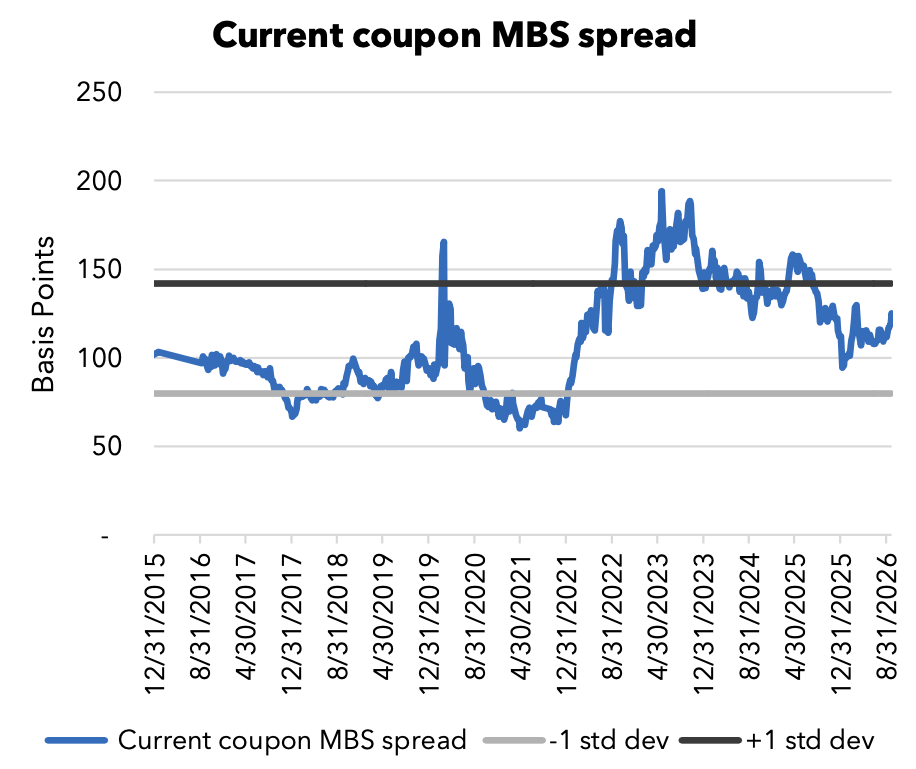
Agency RMBS struggled in September, returning -96 basis points of excess return as the sharp rise in Treasury yields pushed mortgage spreads wider. Current-coupon spreads widened about 12 basis points amid elevated rate volatility, selling by leveraged investors and ETFs, and weak market technicals. The move in rates also extended mortgage durations, as prepayments speeds slowed. As a result, the Bloomberg U.S. Agency Fixed Rate MBS Index duration increased from 5.67 years on August 31 to 5.90 years at month-end. Meanwhile, current mortgage coupons moved above 6%, leaving most of the Index trading below par and approximately half below $90. Higher-coupon, non-agency pass-through securities generally held up better than agency mortgages.
CMBS Excess Return: -4 bps
CMBS was relatively resilient in September, returning -4 basis points of excess return as higher Treasury yields weighed on total returns across spread sectors. While issuance remained healthy and secondary spreads were broadly stable, the sector faced the same duration headwinds that pressured fixed income markets throughout the month. Limited supply in this sector especially in conduit deals, strong investor demand for new-issue SASB transactions, and stable commercial real estate fundamentals helped limit spread widening, allowing CMBS to outperform most mortgage-related sectors. Agency CMBS was the primary source of weakness, returning approximately -9 basis points of excess return.
ABS Excess Return: +9 bps
ABS was the strongest-performing structured-credit sector and the only major sector to generate positive excess returns during September. Credit-card and Auto ABS contributed approximately +6 and +5 basis points of excess return, respectively, while Rate Reduction ABS outperformed the broader sector with approximately +14 basis points of excess return. Within esoteric ABS, spreads widened modestly, as investors reacted to inflation concerns and continued interest-rate volatility. CLOs remained resilient in September, supported by floating-rate income, stable senior spreads, and continued investor demand. Performance was strongest in higher-rated tranches, while investors remained selective around managers, collateral quality, and lower-rated exposures.
Source: AAM, Bloomberg, JP Morgan

Municipal Bonds
By Greg Bell, CFA, CPA
Taxable municipal spreads widened modestly in September but held up better than tax-exempts, supported by limited supply. Tax-exempts sold off sharply and the curve bear-flattened, improving relative value in intermediate and longer maturities, although heavy supply and weakening fund flows argue for patience.
Taxables
Taxable municipal spreads to Treasuries widened during September, with the move concentrated at the front end of the curve. Spreads ended the month at 20, 29, 37, 45 and 50bps in 3-, 5-, 7-, 10- and 30-year maturities, respectively, wider by 3, 12, 9, 4 and 1bp. The five-year absorbed the largest adjustment, moving from 17bps to 29bps, while the ten- and thirty-year points were close to unchanged. Even so, the sector held in materially better than tax-exempts, with the ICE BofA US Taxable Municipal Securities Index (TXMB) returning -1.85% month-to-date through 23 September, 94bps ahead of the tax-exempt index in a month in which the tax-exempt curve repriced 53 to 102bps higher in yield. (Source: AAM, Bloomberg, BofA)
The widening does not appear to be supply driven. Taxable issuance totaled $2.69B across 52 issues in September, up just 3.4% year-over-year and less than 5% of the month’s long-term volume, and year-to-date taxable volume of $24.6B is running 1.4% behind last year. BofA commentary likewise points to nothing in taxable deal flow that would have compromised spread levels. (Source: Bond Buyer, LSEG, BofA, AAM)
Despite the back-up, spreads remain through their five-year averages across most of the curve, by 4, 7, 14 and 13bps in 5-, 7-, 10- and 30-year maturities, with the three-year in line with its average. We continue to view the ten-to thirty-year portion of the taxable curve as fairly valued. (Source: AAM, Bloomberg)
Tax-exempts
September was a rates month, and an unforgiving one. A hawkish repricing of Fed expectations, reinforced late in the month by a September flash PMI well above consensus that lifted the implied probability of an October hike as high as 71%, drove a sharp bear-flattening in Treasuries, with two-year yields higher by 55bps and thirty-year yields higher by 39bps. Tax-exempts amplified the move rather than cushioning it. AAA yields rose 98 to 102bps inside of three years, 73bps in ten years and 53bps in thirty years, reversing August’s municipal-led steepening as the front end caught up; the 2-30yr municipal slope flattened 48bps to 159bps. Muni-to-Treasury ratios cheapened at every point on the curve, with the two-year rising to 72% from 58%, the ten-year to 78% from 71% against a five-year average of 71%, and the thirty-year to 91% from 88%. Returns reflected the damage, with the ICE BofA US Municipal Securities Index (U0A0) down 2.79% month-to-date through 23 September, on pace for its weakest September since 2023 and trailing taxable municipals by 94bps. (Source: Refinitiv MMD, Bloomberg, BofA, AAM)
Technicals turned decisively against the market, and the damage was concentrated in the open-end complex. Weekly reporting funds recorded net outflows of approximately $1.46B across the five reporting weeks of September, taking the four-week moving average from $1,095mn at the end of August to -$399mn, against a rolling one-year average of $876mn. The headline masks a sharp divergence by vehicle. Open-end funds lost approximately $6.1B over the month, with redemptions accelerating to $1.77B, $1.46B and $2.68B in the final three weeks, while exchange-traded funds took in approximately $4.7B, nearly all of it in the last two weeks. That ETF demand was drawn by price: after trading at a discount to the value of its underlying bonds through the first half of the month, the iShares National Muni Bond ETF (MUB) ended September at a 1.2% premium, well outside its normal range, pulling creation flow into the ETF even as open-end shareholders headed for the exit. Those redemptions met a heavy calendar. Long-term issuance totaled $55.45B across 784 issues in September, up 13.7% year-over-year, with the tax-exempt component at $51.05B, up 17.9%, and new money volume up 44.2%; year-to-date volume reached $458.5B, running 6.3% ahead of last year. Deal flow slowed into month-end as issuers postponed transactions in search of a better market entry point, which offered some relief but pushes that supply into an already heavy forward calendar. (Source: Lipper, Bloomberg, Bond Buyer, LSEG)
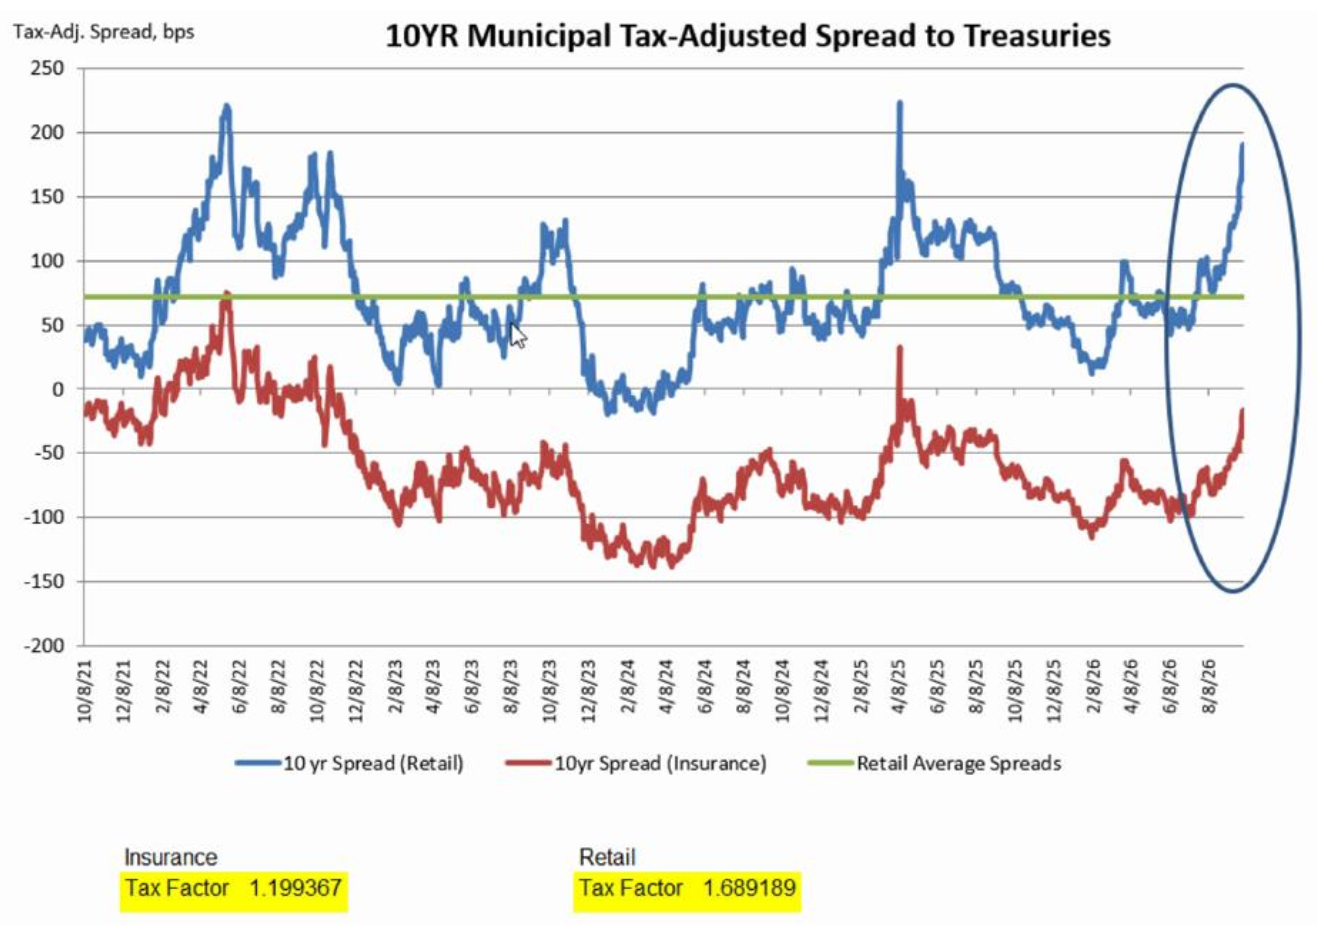
On a tax-adjusted basis, applying the standard gross-up for the 21% corporate rate, spreads to Treasuries widened sharply across the curve, by 58, 49, 34 and 25bps in three-, five-, ten- and thirty-year maturities, respectively. The ten-year tax-adjusted spread ended the month at -37bps, from -71bps at the start of September and against a five-year average of -60bps, among its cheapest levels since the April 2025 dislocation. Fifteen- and twenty-year maturities have moved into positive territory at +5 and +15bps, and the thirty-year now offers a +52bp pickup to Treasuries, nearly double its five-year average of +27bps. (Source: AAM, Bloomberg, Refinitiv)
Tax-exempts continue to carry negative carry relative to spread product, and the crossover case remains selective rather than broad. The sector is, however, approaching a point where institutional investors subject to the 21% rate can make the argument to look at it as a Treasury alternative in certain areas of the curve, particularly in the ten-year area, where the tax-adjusted gap to Treasuries has nearly halved in a single month, and past fifteen years, where it has turned positive. The near-term technical backdrop argues for patience on timing. BofA projects September reinvestment and issuance at roughly $51B apiece, but October issuance of approximately $58B against $42B of principal and coupon payments would turn net supply positive by roughly $16B, the least favorable month of the year, before deals postponed from September are added to the total. (Source: AAM, BofA, Bloomberg)
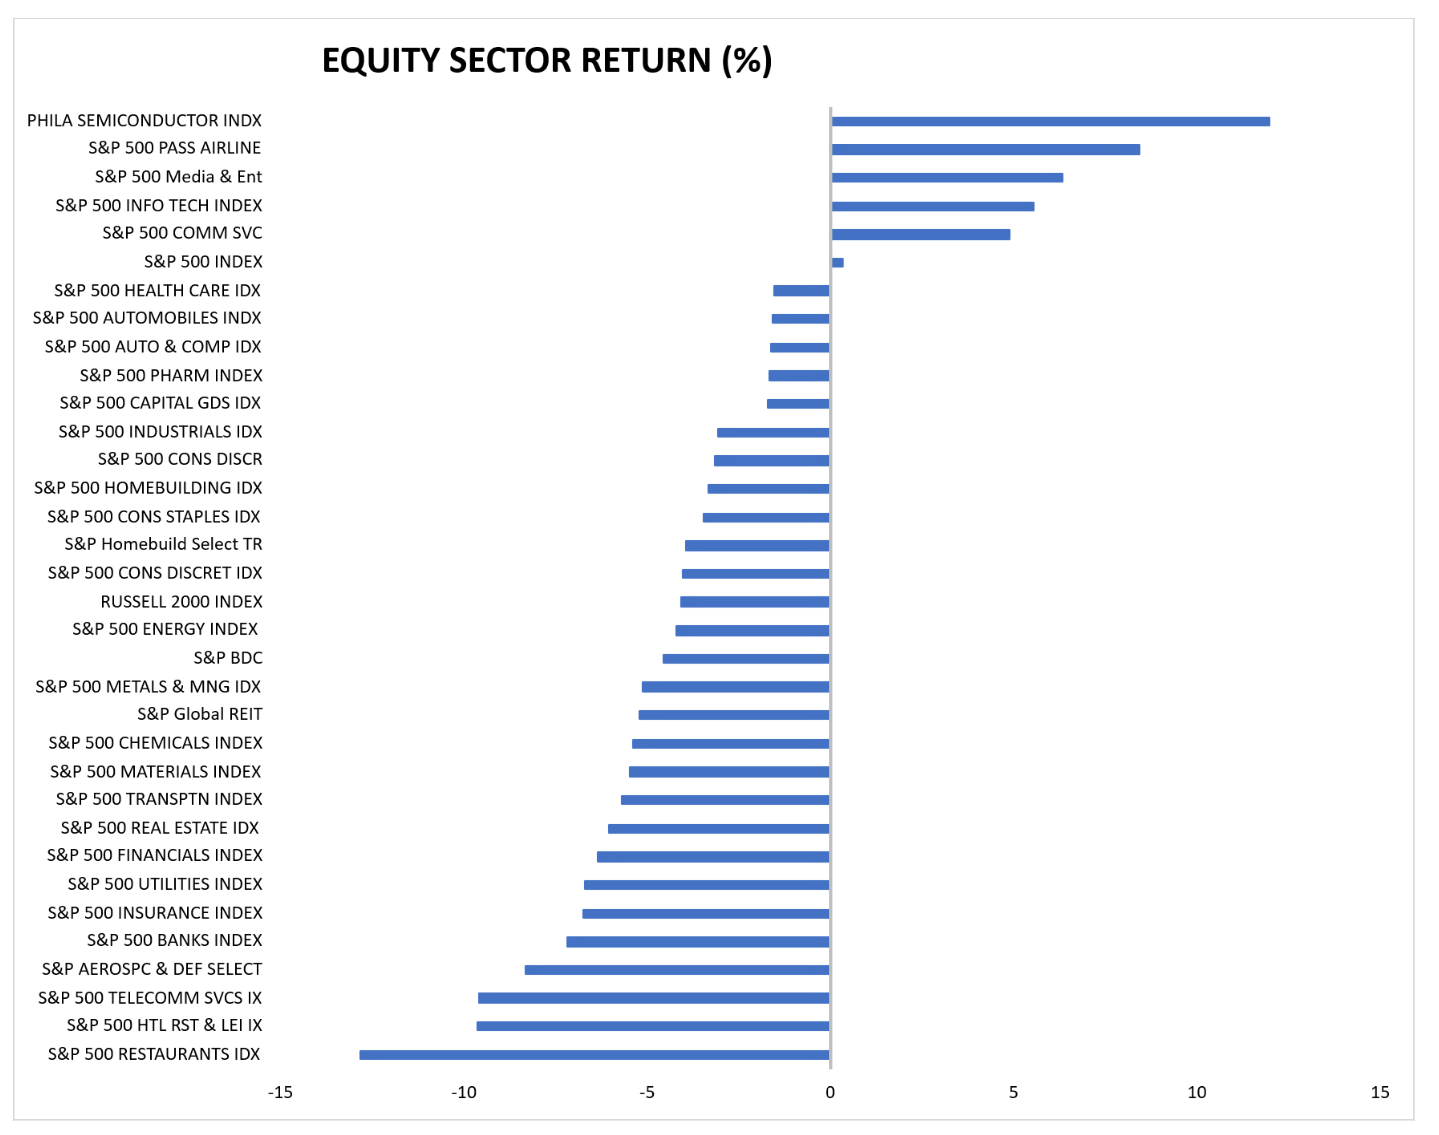
U.S. Equity Performance – September


Corporate Fundamentals 3Q26; Exceptionally Unique Forces Driving Fundamental Strength & Concern
October 19, 2026