Fixed Income Summary
By Elizabeth Henderson, CFA
April unfolded against a stabilizing macro backdrop, where higher U.S. Treasury yields and moderating rate volatility continued to anchor global asset pricing, even as geopolitical risks remained unresolved. Within credit markets, investment-grade corporates demonstrated resilience, reflecting a market more focused on underlying earnings strength and technical supply dynamics than near-term macro risks. Elevated absolute yields sustained investor demand for income, supporting spread products broadly, while structured credit benefited from declining volatility and strong new issue demand. At the same time, municipal markets exhibited mixed technicals, with tax-exempts lagging earlier in the period before recovering on improved relative value, and taxable municipals supported by steady institutional demand. Globally, the environment remained characterized by a “higher-for-longer” rates regime, where resilient growth expectations and delayed central bank easing continued to pressure duration while underpinning credit fundamentals.
IG Fixed Income Recap
Corporate Market
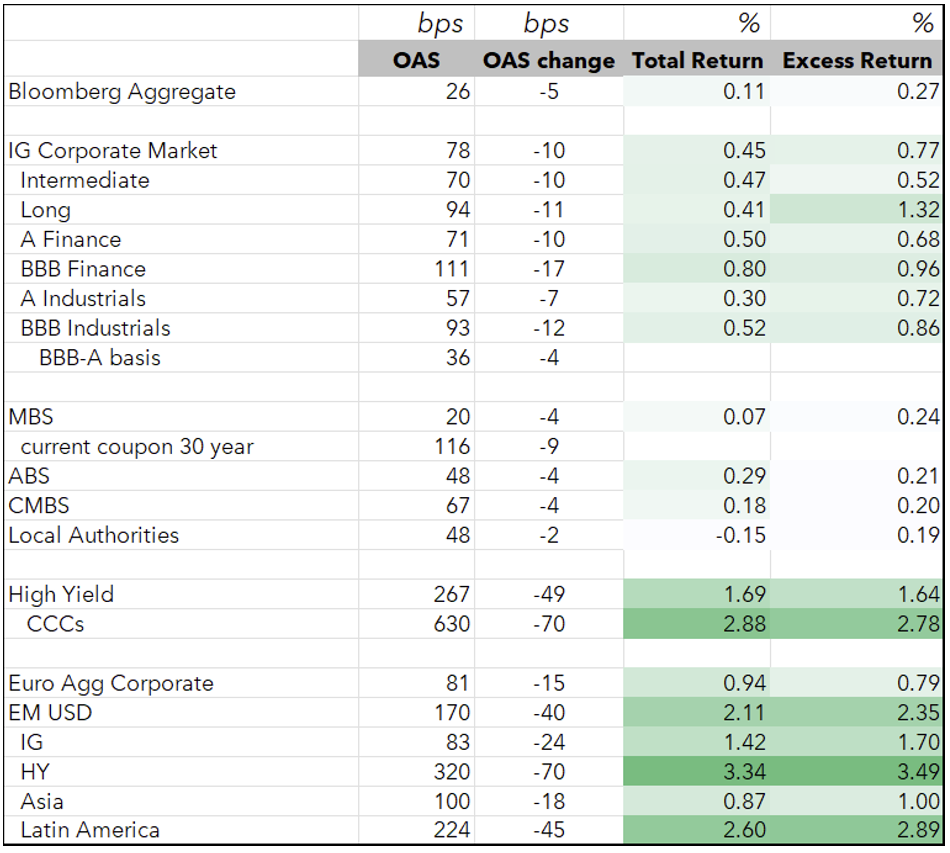
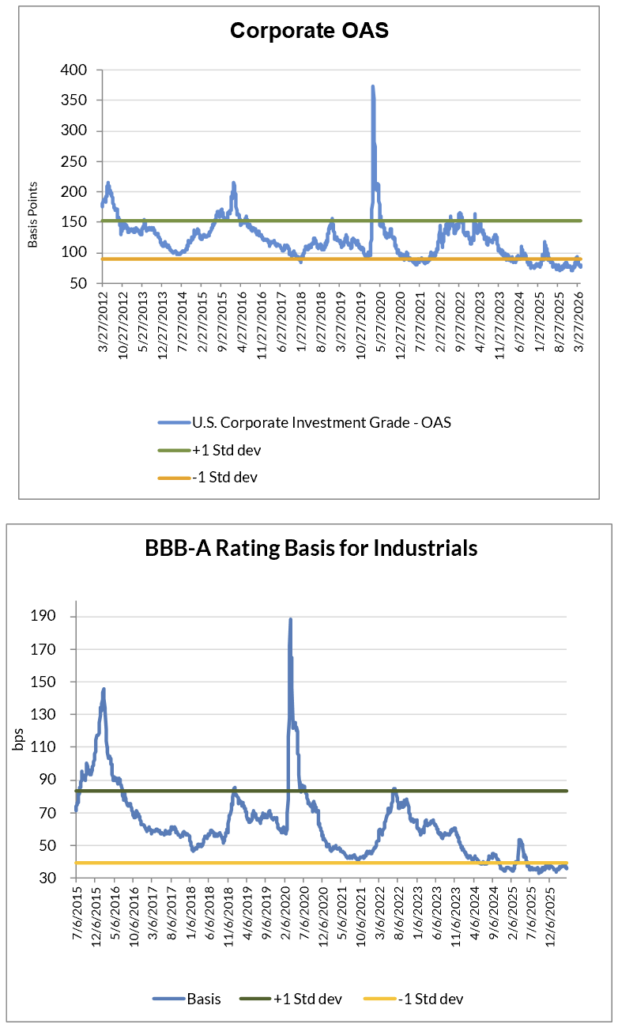
Corporate spreads rallied in April, supported by higher Treasury yields and reduced volatility. Despite ongoing geopolitical headlines and the continued closure of the Strait of Hormuz, markets did not price in the risk to growth, more of a tail risk with a path to resolution, especially as earnings season and management commentary continued to point to supportive underlying fundamentals. In a recent report (“Global Corporates Rating Trends Monitor: April 2026”), Fitch highlighted the growing number of watch-listed credits, foreshadowing an increase in fallen angels and a potential turn in the positive rating trend. Sectors with spreads that are wide vs. historic averages are mostly facing secular risks, while those with tight spreads are benefiting from construction activity in the US and higher commodity prices and defense spending, in part due to the war.
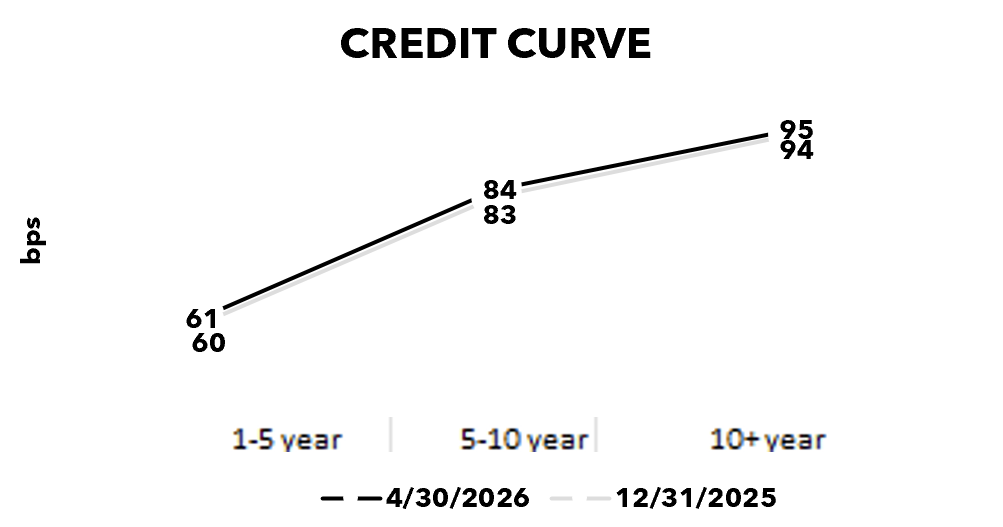
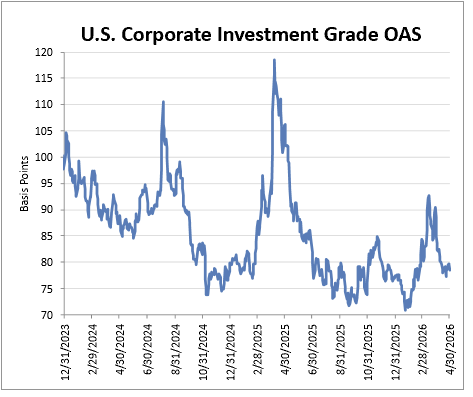
Despite the month’s weakness, corporate OAS remains rich vs. history, still inside long‑term averages and leaving valuations vulnerable to continued rate volatility. ‘BBB’s outperformed ‘A’s in April.
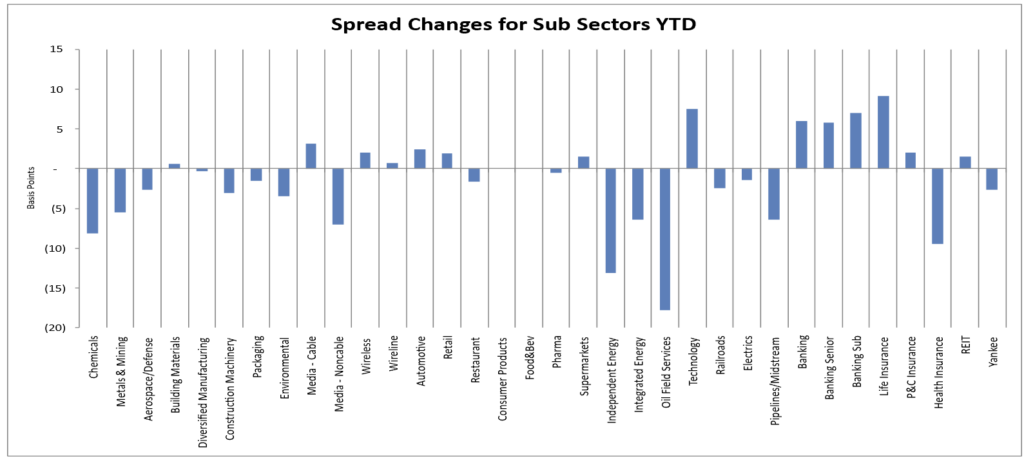
Looking at sectors relative to Industrials (Sector OAS/Industrial OAS):
- Z scores >1.5: Cable, Technology, Health Insurance (LTM), Finance Companies, Life Insurance,
Banking (senior),Food & Beverage, Supermarkets (LTM)
- Z scores <-1.5: Metals & Mining, Environmental, Independent Energy, Midstream,
Pharma, Integrated Energy (LTM),Oil Field Services, Diversified Manufacturing, Construction Machinery (LTM), Aerospace & Defense, Railroads (LTM)
Source: Bloomberg, AAM (bold=new for the month; strike-through = no longer valid vs last month; 5+years unless noted for last twelve months)
Corporate Market Technicals and Rating Changes
With Treasury rates remaining elevated, given the re-pricing of inflation and anticipated Fed cuts, the demand for yield continued to underpin the IG corporate bond market despite elevated macro and geopolitical volatility.
Fund demand weakened for a second consecutive month, with US IG inflows slowing to $9.8B, its smallest monthly inflow since April 2025.
IG new issue market was very active with a late-month surge in hyperscaler issuance, handily beating estimates. Demand was firm with most deals well oversubscribed and low new issue concessions. Execution was strong post-pricing.
May is expected to be a seasonally heavy month of new issuance, with projections of $190B.
Sources: AAM, Wells, BofA
Rating changes this month (rising stars/fallen angels at unsecured level per Bloomberg)
- Fallen angels: Centene, F5KKR
Rising stars: Louisiana-Pacific Corp
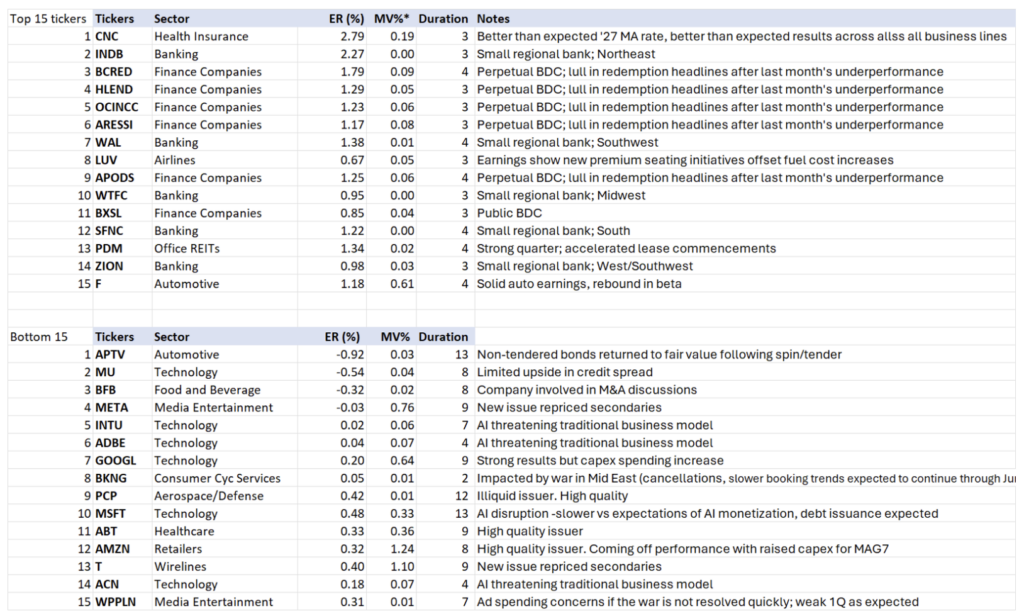
Ticker Level Performance
The following shows the top and bottom performing issuers based on ‘excess return per unit of duration’. This list excludes most with market values less than 0.05% of the Bloomberg Corporate Index as well as non-corporate issuers. AAM’s analysts have provided an explanation for issuer performance when relevant.
Corporate Market Graphs
(Source: Bloomberg, AAM)
Structured Products
By Chris Priebe and Mohammed Ahmed
Structured products delivered modestly positive excess returns in April, helped by a sharp decline in rate volatility and resilient demand despite heavy issuance.
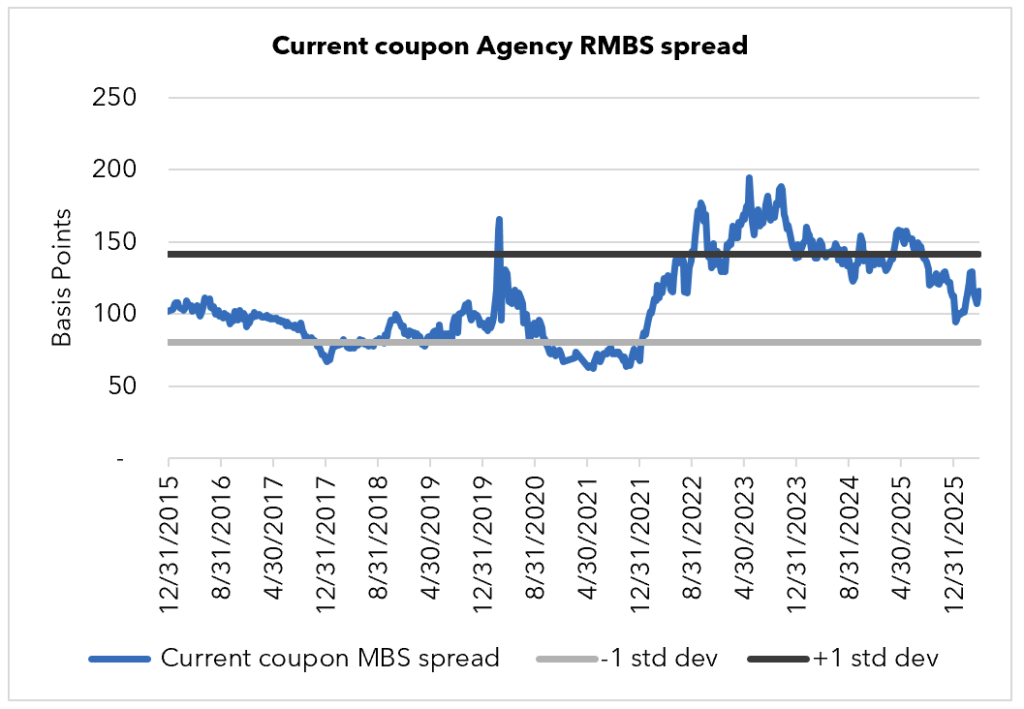
(Source for chart: Bloomberg – FNCL CC Spread to 5/10)
AGENCY RMBS Excess Return: +24 bps
Current coupon Agency RMBS posted their first positive excess returns in two months as spreads tightened by roughly 10 bps in April. Current coupon spreads opened near +125 and closed near +115, reflecting a more constructive technical backdrop as volatility fell and convexity risk diminished. Performance was concentrated in slightly discounted, near-par, and small-premium 30-year coupons (4.50s–5.50s), which benefited most from improved carry/roll characteristics as spreads ground tighter. By contrast, deeper discount 30-year 3.50s and 4.00s were the weakest performers, producing excess returns of roughly -8 bps and 0 bps, respectively. Flows were more muted from traditional balance sheet buyers (banks) and money managers, and overall trading volumes were lower versus prior months. With volatility materially lower into month-end (MOVE volatility index which doubled last month came all the way back down from 115 to 72), technical conditions improved for current coupon carry, setting a better tone entering May so long as rates remain rangebound.
CMBS Excess Return: +20 bps
CMBS generated positive excess return despite one of the largest April supply backdrops in the past decade (approximately $12.5 billion). New issue activity improved as macro volatility declined, and conduit spreads tightened meaningfully—by roughly 16 bps and 11 bps—to about 73 bps (5-year) and 77 bps (10-year). The ability of the market to clear a heavy calendar at tighter spreads suggests that, when volatility is contained, CMBS remains an attractive “spread product” relative to many alternatives—though dispersion within commercial real estate fundamentals continues to argue for selectivity across collateral composition and sponsor quality.
ABS Excess Return: +21 bps
The ABS sector had its busiest April in the last ten years with issuance topping over $35 billion ABS YTD supply is close to $140 billion. ABS produced 21bps of excess return in April despite supply being heavy. Within the sector, performance was mixed: credit cards produced roughly +4 bps, autos +11 bps, and utilities materially outperformed at roughly +90 bps. Longer utility paper tightened and drove much of the outsized excess return, highlighting the role of spread duration in a month where volatility declined and risk appetite improved. In contrast, AAA CLO spreads widened by roughly 7 bps over the month to around +125 for new issue. While higher-quality CLO tranches remain supported by structural protections, underlying leveraged loan headlines and broader risk sensitivity left the CLO complex somewhat out of step with the tightening seen in other securitized areas during April.
Municipal Bonds
By Greg Bell, CFA, CPA
Tax-exempts underperformed amid elevated market volatility and deteriorating demand, which pressured relative valuations. Taxable municipal spreads widened modestly, consistent with broader weakness across other taxable fixed-income sectors.
Taxables
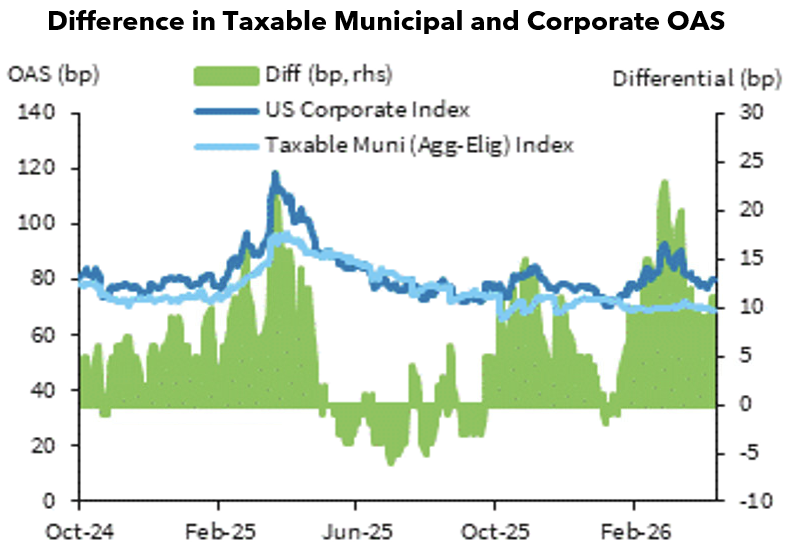
Taxable municipal issuance saw a notably busier calendar during April, but spreads remained in a tight range with modest improvements observed across the curve. New issuance through the first three weeks of April totaled $5.7B, representing a 49% increase relative to April 2025 and a 138% increase on a month-over-month basis. Despite the meaningful step-up in primary market activity, demand remained steady throughout the month, and the supply-demand balance proved supportive of spread tightening. (Source: Bond Buyer, Bloomberg, BofA)
Spreads in 3-, 5-, 10- and 30-year maturities tightened by 5, 5, 4 and 6 bps, respectively, reflecting the resilience of institutional demand even as primary market volume accelerated. Demand remains firmly entrenched in maturities of seven years and shorter, where insurance company and crossover institutional buyers continue to source paper consistently. The higher absolute rate environment during the month also improved demand flows further out the curve, with longer-dated spreads benefiting from renewed yield-driven interest. (Source: AAM, Bloomberg, Morgan Stanley)
Looking ahead, stable underlying credit fundamentals combined with a continued new issue profile that remains modest relative to the broader municipal market should keep spreads rangebound around current levels. While broader rate volatility remains a risk factor, the structural supply-demand dynamic in taxable munis continues to favor spread stability, particularly in the front and intermediate portions of the curve where institutional demand has been most durable. (Source: AAM, Bloomberg; exhibit – Bloomberg, Barclays)
Tax-exempts
Relative value recovery was the dominant theme for tax-exempts during April, as the sector retraced a meaningful portion of the cheapening that had occurred during March. The 10-year muni-to-Treasury ratio improved from 72.9% at month-end March to 67.7% at month-end April, supported by a constructive combination of resilient mutual fund inflows, manageable supply absorption, and a modest rally in tax-exempt yields against a more muted move in Treasuries. Tax-exempt yields in 5- and 10-year maturities fell by 8 and 16bps, respectively, materially outperforming Treasuries which were higher by 6 and 5bps over the same maturities. (Source: Bond Buyer, Bloomberg, Refinitiv)
Mutual fund flows remained positive throughout the month, with the four-week average through April 23rd reaching $597M per week. While this represented an approximate 27% decline from March’s weekly pace, demand remained sufficient to absorb another round of heavy new issuance and to support tightening relative valuations. Reinvestment flows of approximately $37B during the month were anemic, modestly below March’s $41B, while new issue supply totaled $52B following March’s $50B. Despite the unfavorable supply-demand mismatch on the surface, market technicals held up relatively well, reflecting the resilience of the underlying retail and SMA buyer base. (Source: Lipper, Bond Buyer, BofA)
The forward-looking technical backdrop is expected to gradually improve over the next several months. While May new issuance is projected to remain elevated above $50B, reinvestment flows are expected to increase by approximately 51% month-over-month to $56B, providing a meaningfully stronger demand offset than the market experienced in either March or April. This improving reinvestment profile, combined with the post-Tax Day recovery in retail demand, should provide additional support to relative valuation levels into the summer. Absent a renewed bout of broader market volatility that pressures mutual fund flows to weaker levels, the market should see stabilization around current relative valuation levels. (Source: Bond Buyer, BofA, Bloomberg)
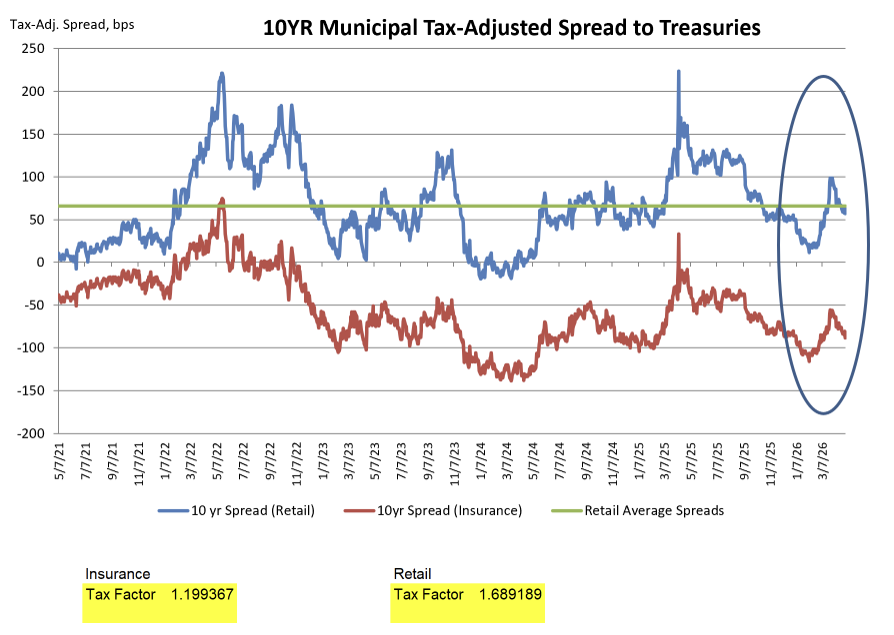
On a tax-adjusted basis, institutions taxed at the 21% corporate rate saw spreads contract by 16 and 24bps in 5- and 10-year maturities, respectively, ending the month at spreads to Treasuries of -90 and -82bps. While these levels reflect meaningful tightening from March, taxable alternatives continue to provide a substantial yield advantage to tax-exempts for institutional investors, limiting crossover demand for tax-exempt securities at current relative value levels. (Source: AAM, Bloomberg, Refinitiv)
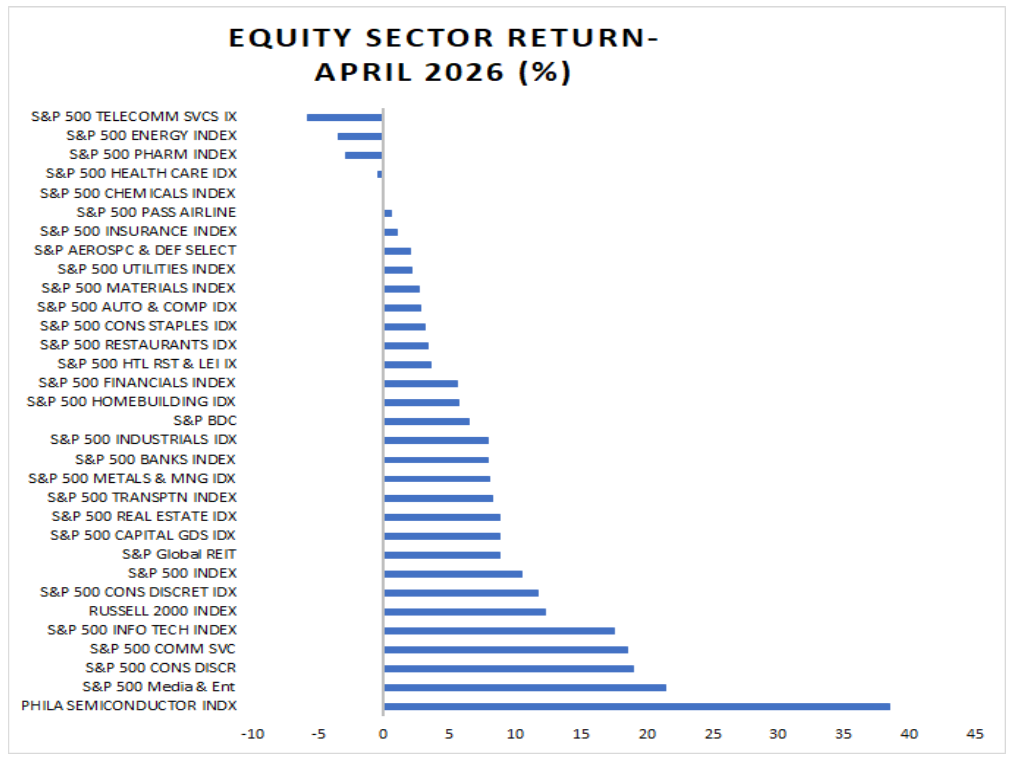
U.S. Equity Performance


Corporate Fundamentals 2Q26; AI Debt Issuance Can’t Stop Won’t Stop
July 16, 2026