Fixed Income Summary
By Elizabeth Henderson, CFA
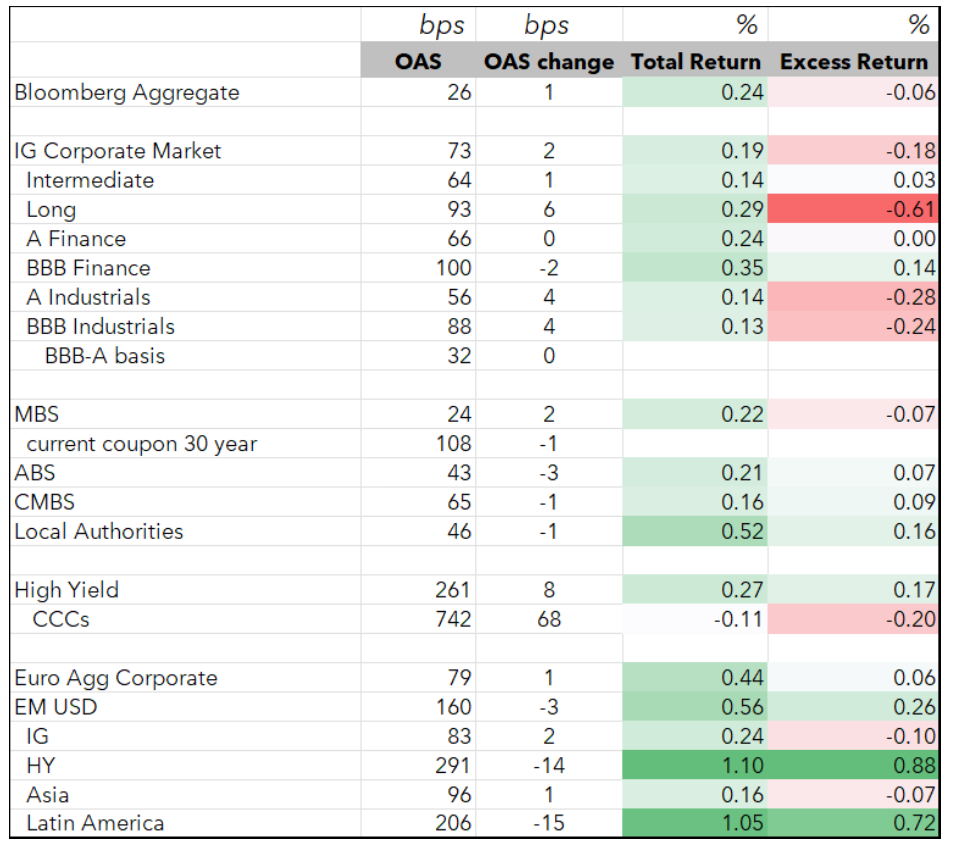
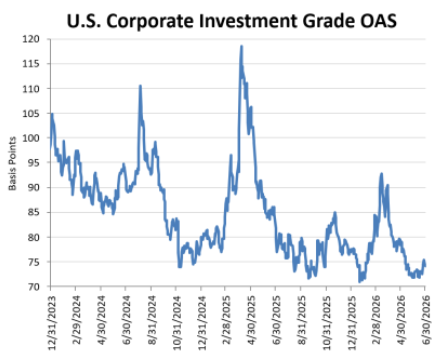
Investment grade fixed income posted modestly positive to roughly flat total returns in June. The first FOMC meeting under new Federal Reserve leadership struck a hawkish tone, and with inflation still elevated alongside a firm labor market, markets repriced toward a higher-for-longer, and potentially higher, policy rate path. Within investment grade, a constructive underlying tone was tempered by heavy supply. Corporate spreads widened modestly, with the Bloomberg Corporate OAS moving from +72 to +74 bps, as a record June of new issuance was absorbed by still-solid demand. Structured products were mixed: Agency RMBS produced slightly negative excess returns (-7 bps) amid Treasury curve volatility, while CMBS (+9 bps) and ABS (+7 bps) delivered positive excess returns despite one of the busiest new-issue months in years. In municipals, taxable spreads widened modestly across the curve against a constrained supply backdrop, while tax-exempts held in well.
IG Fixed Income Recap
Corporate Market
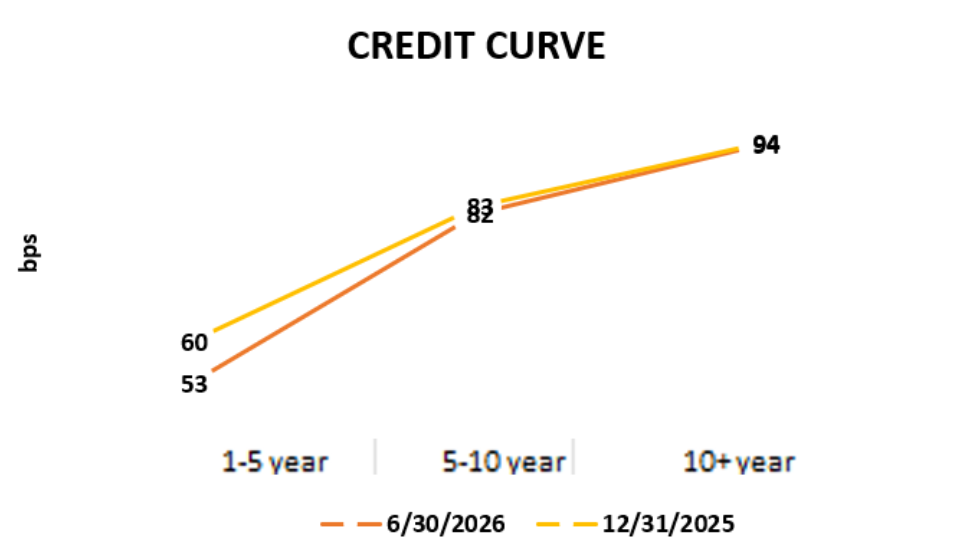
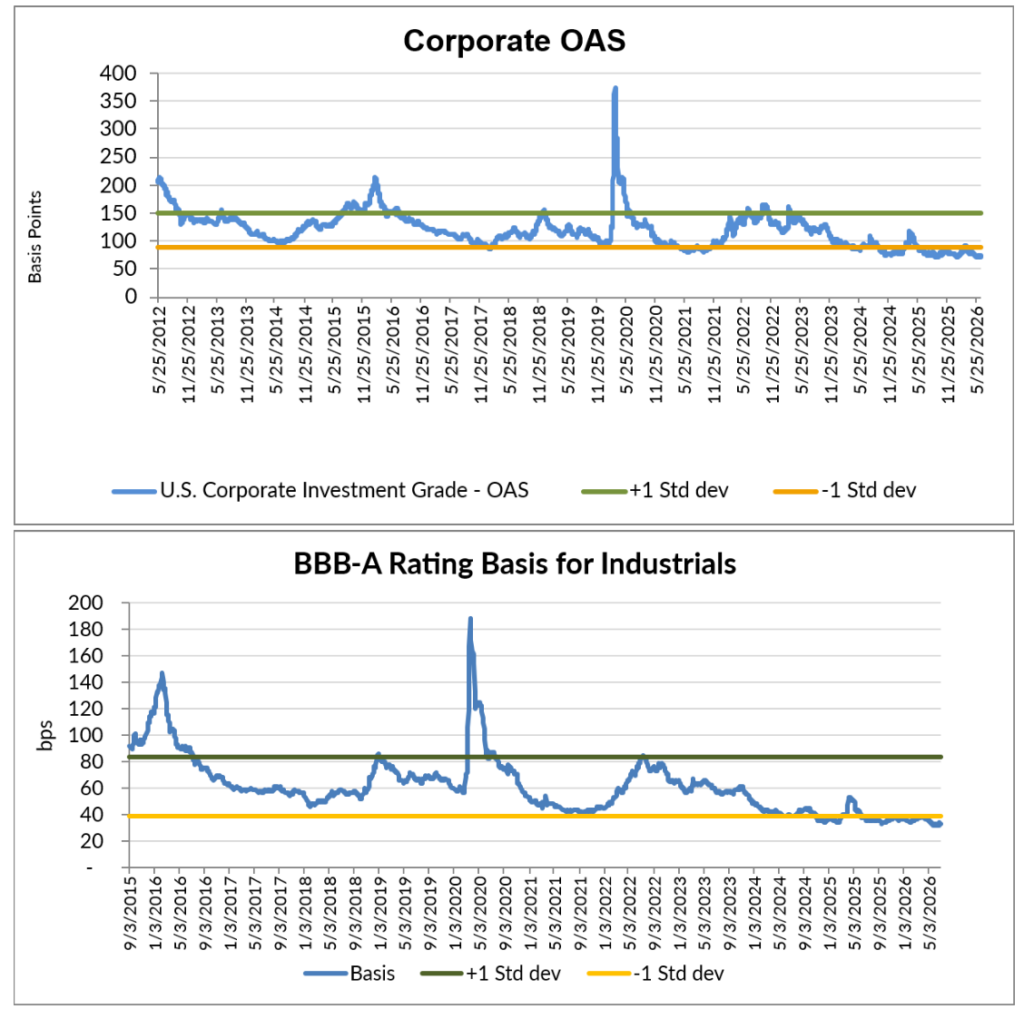
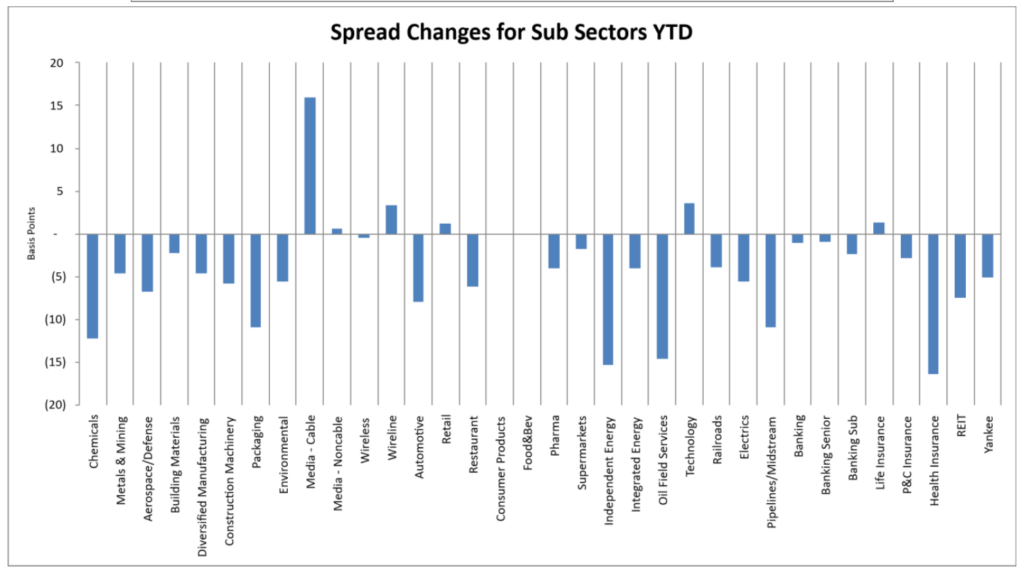
IG spreads widened modestly in June, as the Bloomberg Corporate OAS moved from +72 to +74 bps. Commodity sectors and those related to M&A and/or AI disruption generally underperformed while sectors poised to benefit from a steeper 2s10s curve and a re-opening of the Strait of Hormuz outperformed. Demand for IG corporate bonds remains strong, incentivizing a very active new issue market. AI capex spending continues to dominate the narrative with over $100B issued thus far in 2026 and $50B+ more expected in the second half. Second-quarter earnings announcements will begin soon, and per Morgan Stanley, consensus estimates point to four consecutive quarters of double-digit earnings growth for IG issuers, with a similar bottom-up outlook for high- yield and loans, supporting a constructive fundamental backdrop into year-end.
Looking at sectors relative to Industrials (Sector OAS/Industrial OAS):
• Z scores >1.5: Cable, Technology, Finance Companies, Life Insurance, Supermarkets
• Z scores <-1.5: Metals & Mining, Environmental, Independent Energy, Midstream, Aerospace & Defense, Restaurant, Pharma, Packaging
Source: Bloomberg, AAM (bold=new for the month; strike-through = no longer valid vs last month; 5+years unless noted for last twelve months)
Corporate Market Technicals and Rating Changes
June issuance was record- breaking at $202B, well above expectations, as historically May exceeds June supply. The last year that occurred was 2014, when credit spreads hit post-GFC tight levels, only to widen later in the year due to growth concerns and geopolitical risks. Year-to-date issuance is at 62% of the full-year estimate for 2026.
The second half of 2026 is expected to be around 25% lighter than the first per JPM. The sectors forecasted to be more active in the second half include Consumer, REITs, and Basic Industries. Sectors expected to be less active include: Yankee Banks, Telecom, US Banks, Finance Companies, and Utilities.
July issuance is expected to be around $100B. The average tenor is a year longer at 10 years vs. 9 last year. The average coupon for bonds issued in the first half of 2026 was 185 bps higher than those maturing.
Sources: AAM, JPM
Rating changes this month (rising stars/fallen angels at unsecured level per Bloomberg)
– Fallen angels: none
– Rising stars: Ciena, Carnival Corp, Crowdstrike Holdings
Ticker Level Performance
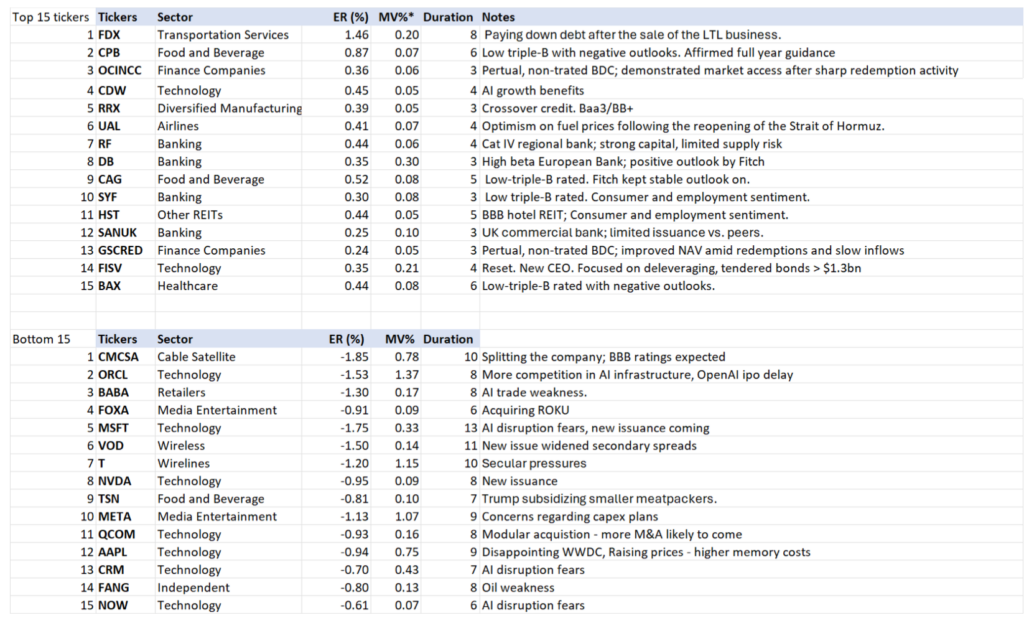
The following shows the top and bottom performing issuers based on ‘excess return per unit of duration’. This list excludes most with market values less than 0.05% of the Bloomberg Corporate Index as well as non-corporate issuers. AAM’s analysts have provided an explanation for issuer performance when relevant.
Corporate Market Graphs
(Source: Bloomberg, AAM)
Structured Products
By Chris Priebe and Mohammed Ahmed
Agency MBS underperformed slightly while CMBS and ABS produced positive excess returns in June.
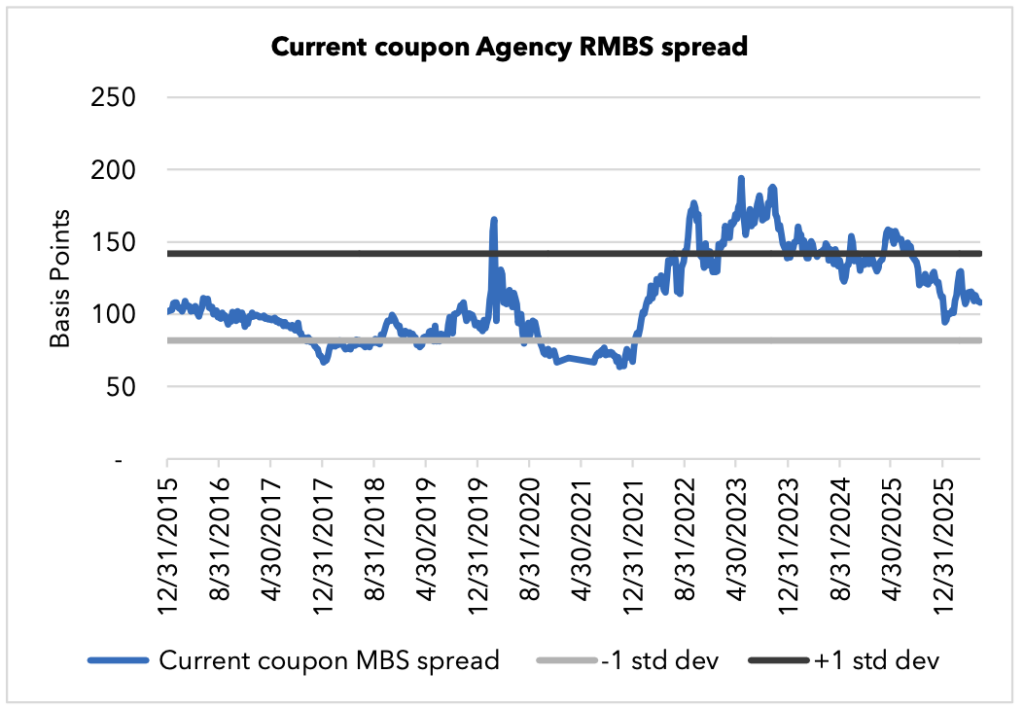
(Source for chart: Bloomberg – FNCL CC Spread to 5/10)
AGENCY RMBS ER -7 bps
Current coupon RMBS spreads produced slightly negative excess returns this month. June spreads were basically unchanged on the month (i.e., current coupon spreads opened near +108 and closed near +107). Performance was barbelled, as 30-year 2.00’s and 6.50’s were the worst performers in June with -21 and -16 basis points, respectively. 30-year 5.50s and 6.00s were the top performers, with excess returns of +10 and +23 basis points. MBS buying flows were significantly lower than in previous months, as investors, mainly Money Managers, were in a holding pattern awaiting further FOMC guidance. Treasury curve volatility was a big factor this month, and 2s to 10s Treasuries ran down to a low of +20 bps, now back near +30 bps. This flattener impacts bank buying and CMO deal issuance, another reason flows were down this month.
CMBS ER 9 bps
Private-label CMBS had one of the busiest Junes in a decade with over $16.5 billion in issuance. The heavier-than-usual supply in new-issue deals continued to come at decent concessions relative to secondary levels. New issue spreads held in well with 5 yr spreads at 69, and 10 yr spreads at 74. Agency CMBS also had positive excess returns in a month where rate volatility, as implied by the MOVE index, increased and then settled unchanged.
ABS ER 7 bps
The ABS sector had a heavy month of new issue, but supply was down from June’s record month. $34 billion of supply hit this month, a billion more than June of 2025 YTD. New-issue sales have jumped 20% from 2025 to $212 billion. ABS produced 7 bps of excess return in June. Autos and Cards led the way with 10 and 9 basis points, respectively, while Utilities lagged with -7 basis points. AAA CLO spreads were a few points tighter in June as Libor assumptions rose 8 basis points to 3.73% from 3.65%.
Municipal Bonds
By Greg Bell, CFA, CPA
Taxable muni spreads widened modestly across the curve in June amid a constrained supply backdrop. Tax-exempt munis held in well against a weakening Treasury market. Technicals in tax-exempts are expected to provide a boost to demand over the next two months.
Taxables
The taxable municipal supply backdrop remains notably constrained. According to J.P. Morgan, taxable issuance year-to-date stands at just $16B, down 23% year-over-year and 45% below the five-year average, against a full-year issuance call of $55B. Supply technicals are expected to remain manageable over the balance of the year and should continue to be supportive of current spread levels. (Source: JPM)
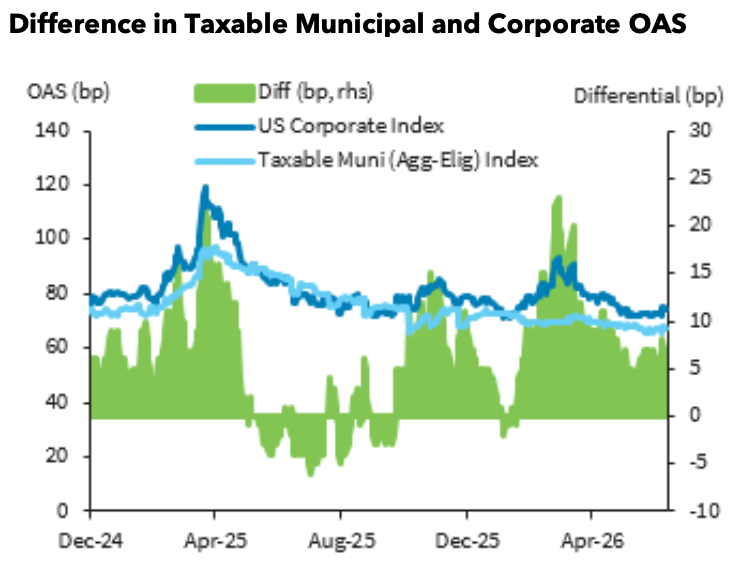
After stronger demand in the elevated rate environment pressured spreads lower during the early part of June, demand appears to have moderated as the month progressed. Spreads subsequently weakened by 3, 5, 5, 3 and 5bps in 3-, 5-, 7-, 10- and 30-year maturities, respectively, giving back a portion of the earlier tightening. (Source: AAM, Bloomberg)
Despite the modest back-up, current spread levels sit right at their year-to-date averages and remain close to their tightest levels over the past five years across most of the curve. The principal exception is the 10-year area, where current spreads still stand approximately 20bps away from their five-year tightest point, continuing to mark that portion of the curve as the more attractive area for investment. A stable underlying credit environment and a persistently muted new issue profile should keep taxable spreads rangebound around current levels in the near term. (Source: AAM, Bloomberg) (Graph above: AAM, Bloomberg, Barclays)
Tax-exempts
Mutual fund flows continued to provide a strong source of support for the market during June. The four-week moving average came in at $965M, and while that represented a 45% decline from the average pace recorded during May, it still constituted another solid layer of demand. Working in conjunction with a robust reinvestment profile of approximately $80B for the month, the combined flows were sufficient to sustain the constructive demand tone heading into the summer. (Source: Lipper)
Technicals are expected to provide a substantial boost to demand over the next two months. Reinvestment flows from coupons, calls and maturities are projected to deliver similar support of approximately $77B and $85B in July and August, respectively. While new issue supply over the same period is expected to remain elevated at approximately $50B and $56B, the progressively stronger reinvestment profile should continue to underpin the improving technical backdrop for the sector. (Source: BofA)
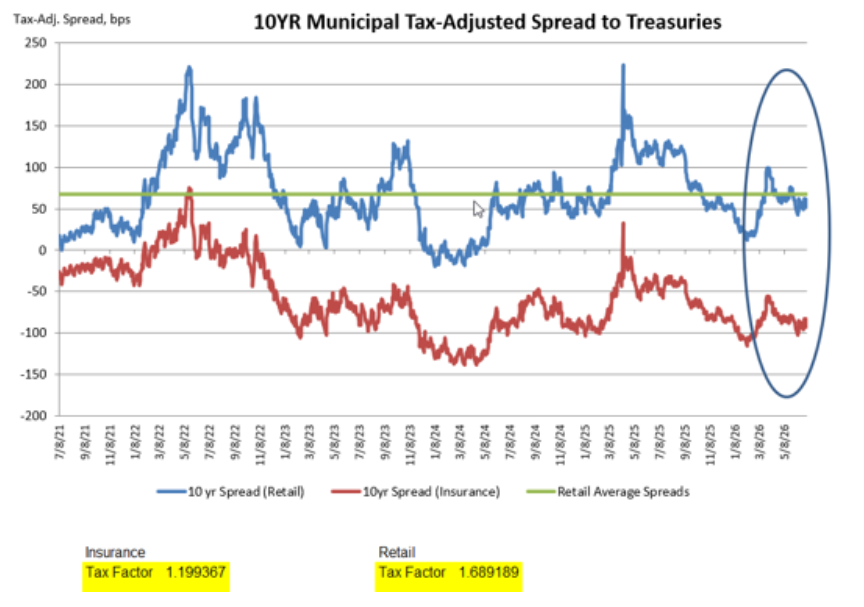
This favorable technical profile allowed the tax-exempt sector to hold in well against a weakening Treasury market. As market expectations shifted toward a more hawkish Fed and the potential for rate hikes, two-year Treasury yields moved higher by 17bps over the month; tax-exempts, by contrast, firmed by 7bps in two-year maturities as the favorable technicals continued to build into June. Relative performance was solid as a result, with the 10-year muni/Treasury ratio ending the month at 66%, in line with the year-to-date average and still approximately 5 percentage points through the five-year average of 70.9%. (Source: Bloomberg, Refinitiv)
On the supply side, overall issuance on a year-to-date basis is running 3% ahead of last year’s pace at $277.8B as of 17 June and remains on track to reach $600B for the full year, against roughly $701B of principal redemptions andcoupon payments. (Source: BofA) On a tax-adjusted basis, spreads to Treasuries moved tighter across the curve during the month, contracting by 16, 12, 6 and 16bps in 3-, 5-, 10- and 30-year maturities, respectively. The 10-year tax-adjusted spread ended the month at -93bps. At these levels, taxable alternatives continue to provide a substantial yield advantage relative to tax-exempts at all points along the curve, continuing to limit crossover demand for institutional investors subject to the 21% corporate tax rate. (Source: AAM, Bloomberg, Refinitiv)
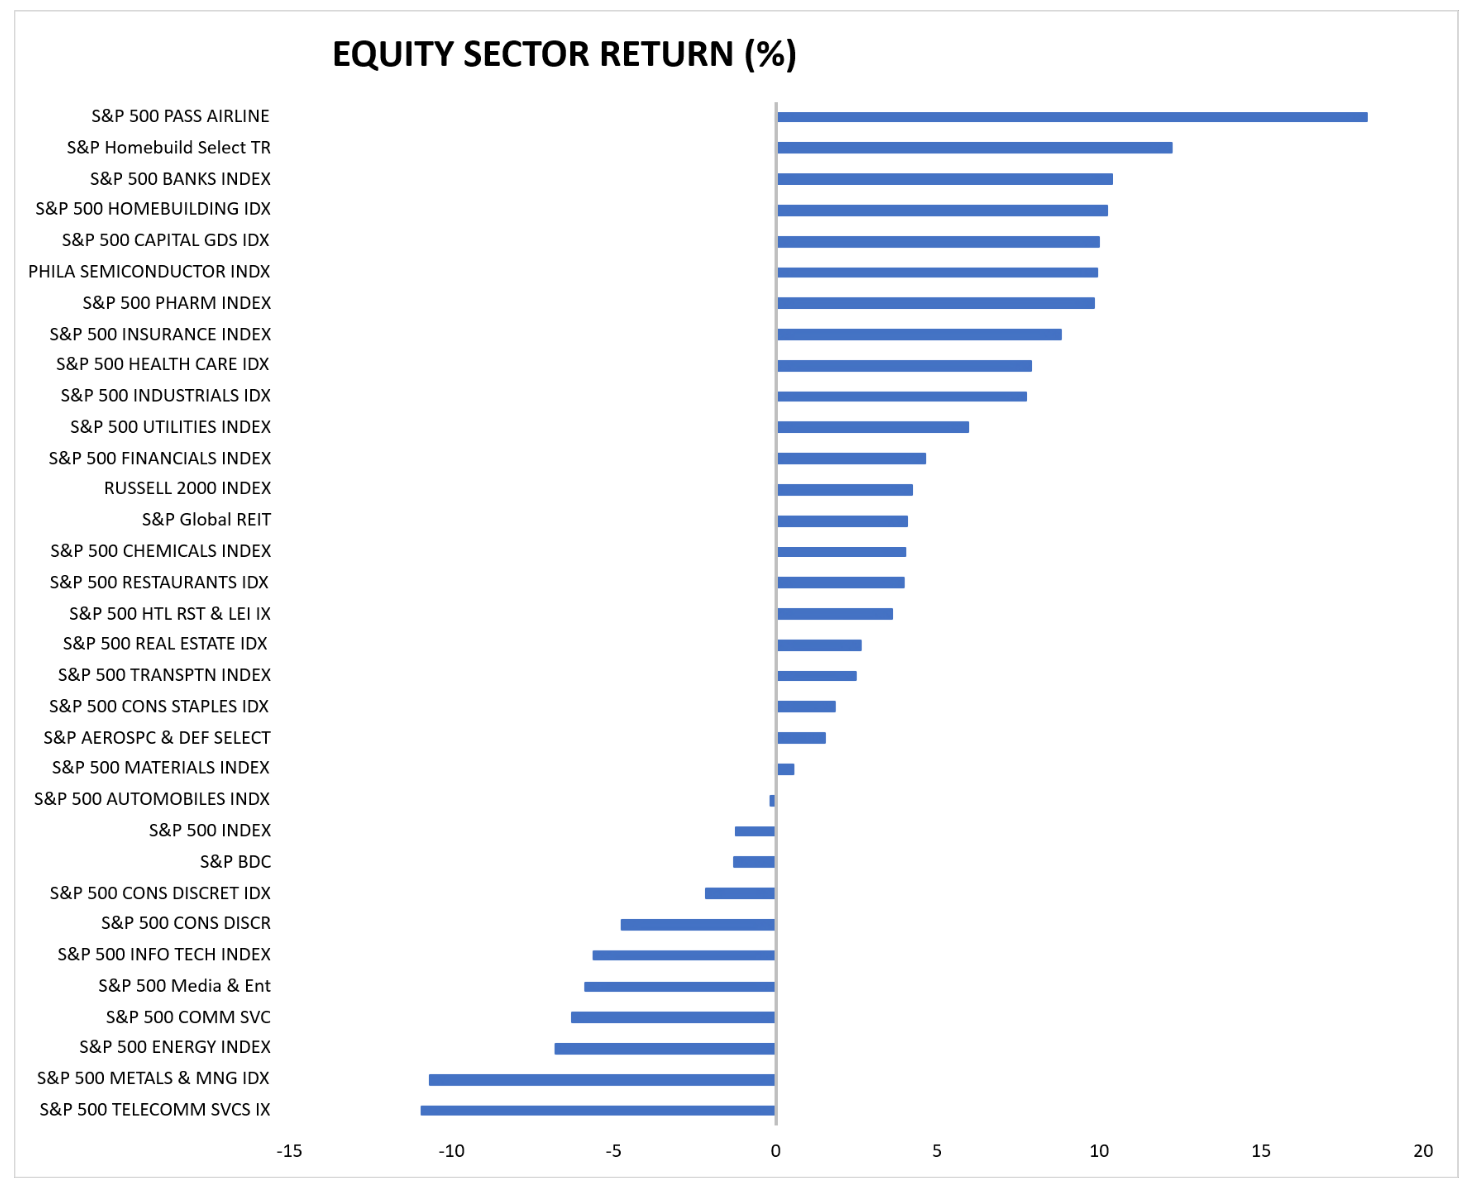
U.S. Equity Performance – June